Experiment with virtual 5G networks in kubernetes
Prerequisites
You have a Slices account
You have successfully followed the previous tutorial
You have a basic understanding of the slices CLI, the notions of projects and experiments
You have a basic understanding of kubernetes and containers
You have a good understanding of the 5G architecture
Important: It is NOT POSSIBLE run this experiment directly from your own machine. It is mandatory to use the Webshell we provide.
TL;DR
We follow these steps to deploy a fully virtual 5G + 5G RAN + 5G UE environment in the SLICES-RI kubernetes cluster:
Go to the calendar https://post-5g-web.slices-ri.eu and book one resource (e.g., standard-2-1) for the time slot when you want to run the experiment.
Go to the webshell https://post-5g-web.slices-ri.eu and execute
slices project use post5g-betato use the project;slices experiment create my_experiment --duration 2hto create an experiment;post5g experiment prefix my_experimentto obtain an IP prefix.
Follow the Assistant https://post-5g-web.slices-ri.eu to setup your 5G network, using the resource you booked and the IP prefix you obtained; Upload the example experiment script from https://gitlab.inria.fr/slices-ri/blueprints/post-5g/examples/-/archive/simple_ping/examples-simple_ping.tar.gz.
Go to the webshell https://post-5g-web.slices-ri.eu and execute
post5g experiment get my_experimentto download the experiment script generated by the assistant;post5g experiment launch my_experimentto launch the experimentpost5g experiment prefix my_experiment --releaseto release the prefix once your experiment is finished.
The experiment is completed, results have been uploaded to the MRS/DMI.
Step 0 - Create a SLICES experiment
Log in with your Slices account at the Post-5G Blueprint Service and chose from the drop down menu the project on which you want to run the experiment, e.g., post5g-beta. From there, go to the pos Webshell section. This will open a webshell window.
Instruct the webshell to use the selected project (e.g., post5g-beta) by running the following command:
slices project use post5g-beta
Your webshell is then configured to operate within the context of this project. You can proceed to initialize the SLICES experiment for the Post-5G test by running the following command. In this example, the experiment is named my_experiment, but feel free to adapt the name as needed.
slices experiment create my_experiment --duration 4h
This command creates an experiment named my_experiment in the project post5g-beta, with a duration of 4 hours. Adjust the duration according to your requirements (e.g., 3h, 1d, 1w. Default duration is 1 day), you can also specify an expiration date instead (dates are of the form %Y-%m-%d | %Y-%m-%dT%H:%M:%S | %Y-%m-%d %H:%M:%S).
Now that we have a SLICES project and an experiment, we can define the Post-5G experiment we want to conduct.
Step 1 - Experiment definition
For this experiment, we use the Post-5G service to deploy a 5G core and a disaggregated RAN in the central SLICES-RI Kubernetes cluster. The gNB is divided into a CU-UP, CU-CP, and a DU. Interfaces N1, N2, N3, N4, N6, F1, and E1 are each assigned a dedicated network interface using Multus, with their own IP addresses. Figure below shows the logical interfaces of the various functions, multus interfaces are depicted in blue and interfaces using the kubernetes pod network are depicted in black. Additionally, the NRF is assigned an IP address to ensure it is accessible from any resource within the SLICES infrastructure.
The deployement in the kubernetes cluster is illustrated in the figure below.
        graph TD
    subgraph cluster [centralhub k8s cluster]
        subgraph 5g_core [core namespace]
            amf(AMF)
            smf(SMF)
            nrf(NRF)
            upf(UPF)
            ric(flexric)
            misc(...)
        end
        subgraph 5g_ran [ran namespace]
            du(DU)
            cu_cp(CU-CP)
            cu_up(CU-UP)
        end
        subgraph ue_ns [ue namespace]
            5g_ue(UE)
        end
    end

    5g_core <--> 5g_ran
    du <-.-> |RF simulator| 5g_ue
A RIC is deployed in the core. The experiment consists of sending 4 ping probes from the UE to the UPF. The experiment is implemented using an Ansible playbook. The experiment can be found on simple ping example repository. Feel free to explore it for a better understanding of the overall approach.
The 5G network, consisting of a core, a RAN, and a UE connected to the RAN through a simulated radio, is implemented using the SLICES post-5G blueprint reference implementation. Currently, we are utilizing the develop branch, but it is expected to transition to a stable release soon. We recommend reviewing the SLICES Post-5G blueprint reference implementation code for a thorough understanding of what is being proposed.
The reference implementation uses OpenAirInterface, deployed via Helm charts. Consequently, each 5G function mentioned above is implemented with a Kubernetes deployment (essentially a pod and service). The RIC is implemented using FlexRIC, the RIC solution provided by OpenAirInterface. Read the official OpenAirInterface documentation for details about OpenAirInterface in Kubernetes.
As mentioned earlier, certain functions require IP addresses. Therefore, we need to first acquire an IP prefix for our 5G network functions that utilize Multus, as well as an IP address for the NRF. To obtain them, run the following command:
post5g experiment prefix my_experiment
It returns you a subnet and an LB IP address, remember these addresses as we will use them later on.
NOTES: IP addresses are limited resources, as soon as you don’t need them anymore, please release them so that other users can benefit from our pool of IP addresses (e.g.,
post5g experiment prefix my_experiment --release).
Experiments are managed from a deployment node, which can be any machine controlled by POS and is used to deploy the 5G network in the SLICES infrastructure (the 5G network is not run on the deployement node!) and execute the experiment script provided by the user. Experiment scripts should be packaged as a gzip-compressed tarball (i.e., a tar.gz file) that pos will retrieve via a public URL (see below). The entry point for the experiment must be the xp/xp.sh file, which POS will use to run the experiment on top of the 5G infrastructure. Ensure that your tarball includes this file and that it can be executed on the deployment node (e.g., AMD64 Ubuntu Jammy). You can find experiment script examples in the Post-5G blueprint example repository. Feel free to explore the examples for a better understanding of the overall approach.
The tarball file that you provide must respect the following structure:
my_xp/
├── dir_1
│   ├── file_1
│   ├── ...
│   ├── file_n
│   ├── dir_1
│   ├── ...
│   └── dir_n
├── ...
│   ├── ...
│   └── ...
│       └── ...
├── file_1
├── ...
├── file_n
└── xp.sh
You can include as many files and directories as needed, at any depth, but they must all be placed within a single root directory, which can have any name (e.g., my_xp). The xp.sh entrypoint must be located in this root directory.
IMPORTANT: The purpose of this tarball is not to hold data but to contain the experimentation scripts.
If your experiment relies on datasets, they should not be included in this tarball. Instead, your xp.sh script should handle retrieving them from their original source (e.g., using wget or git).
If your experiment generates files that you wish to publish, ensure they are placed in the ~/results directory of the deployment node. POS will then automatically retrieve and publish them with the MRS (see step 5). Meanwhile, POS collects the entire standard output and standard error streams and publishes them with the MRS, so there’s no need to redirect your command outputs to files in the ~/results directory (although you can do so if preferred but it’s redundant) (see step 5).
Choose the node based on your experiment’s processing, memory, and storage needs. In this example, since the experiment script is simple (run an ansible playbook executing the ping command on a kubernetes container running in the SLICES kubernetes cluster) and doesn’t require extensive processing or storage, we’ll use the standard-2-1 resource, a lightweight virtual machine.
To configure the 5G network, visit the Configure Post-5G BP section of the Post-5G Blueprint Service. Authenticated sessions are time limited, so it is possible that you have to authenticate yourself again when visitin this page, make sure that you select the same project as the one you used above (e.g., post5g-beta).
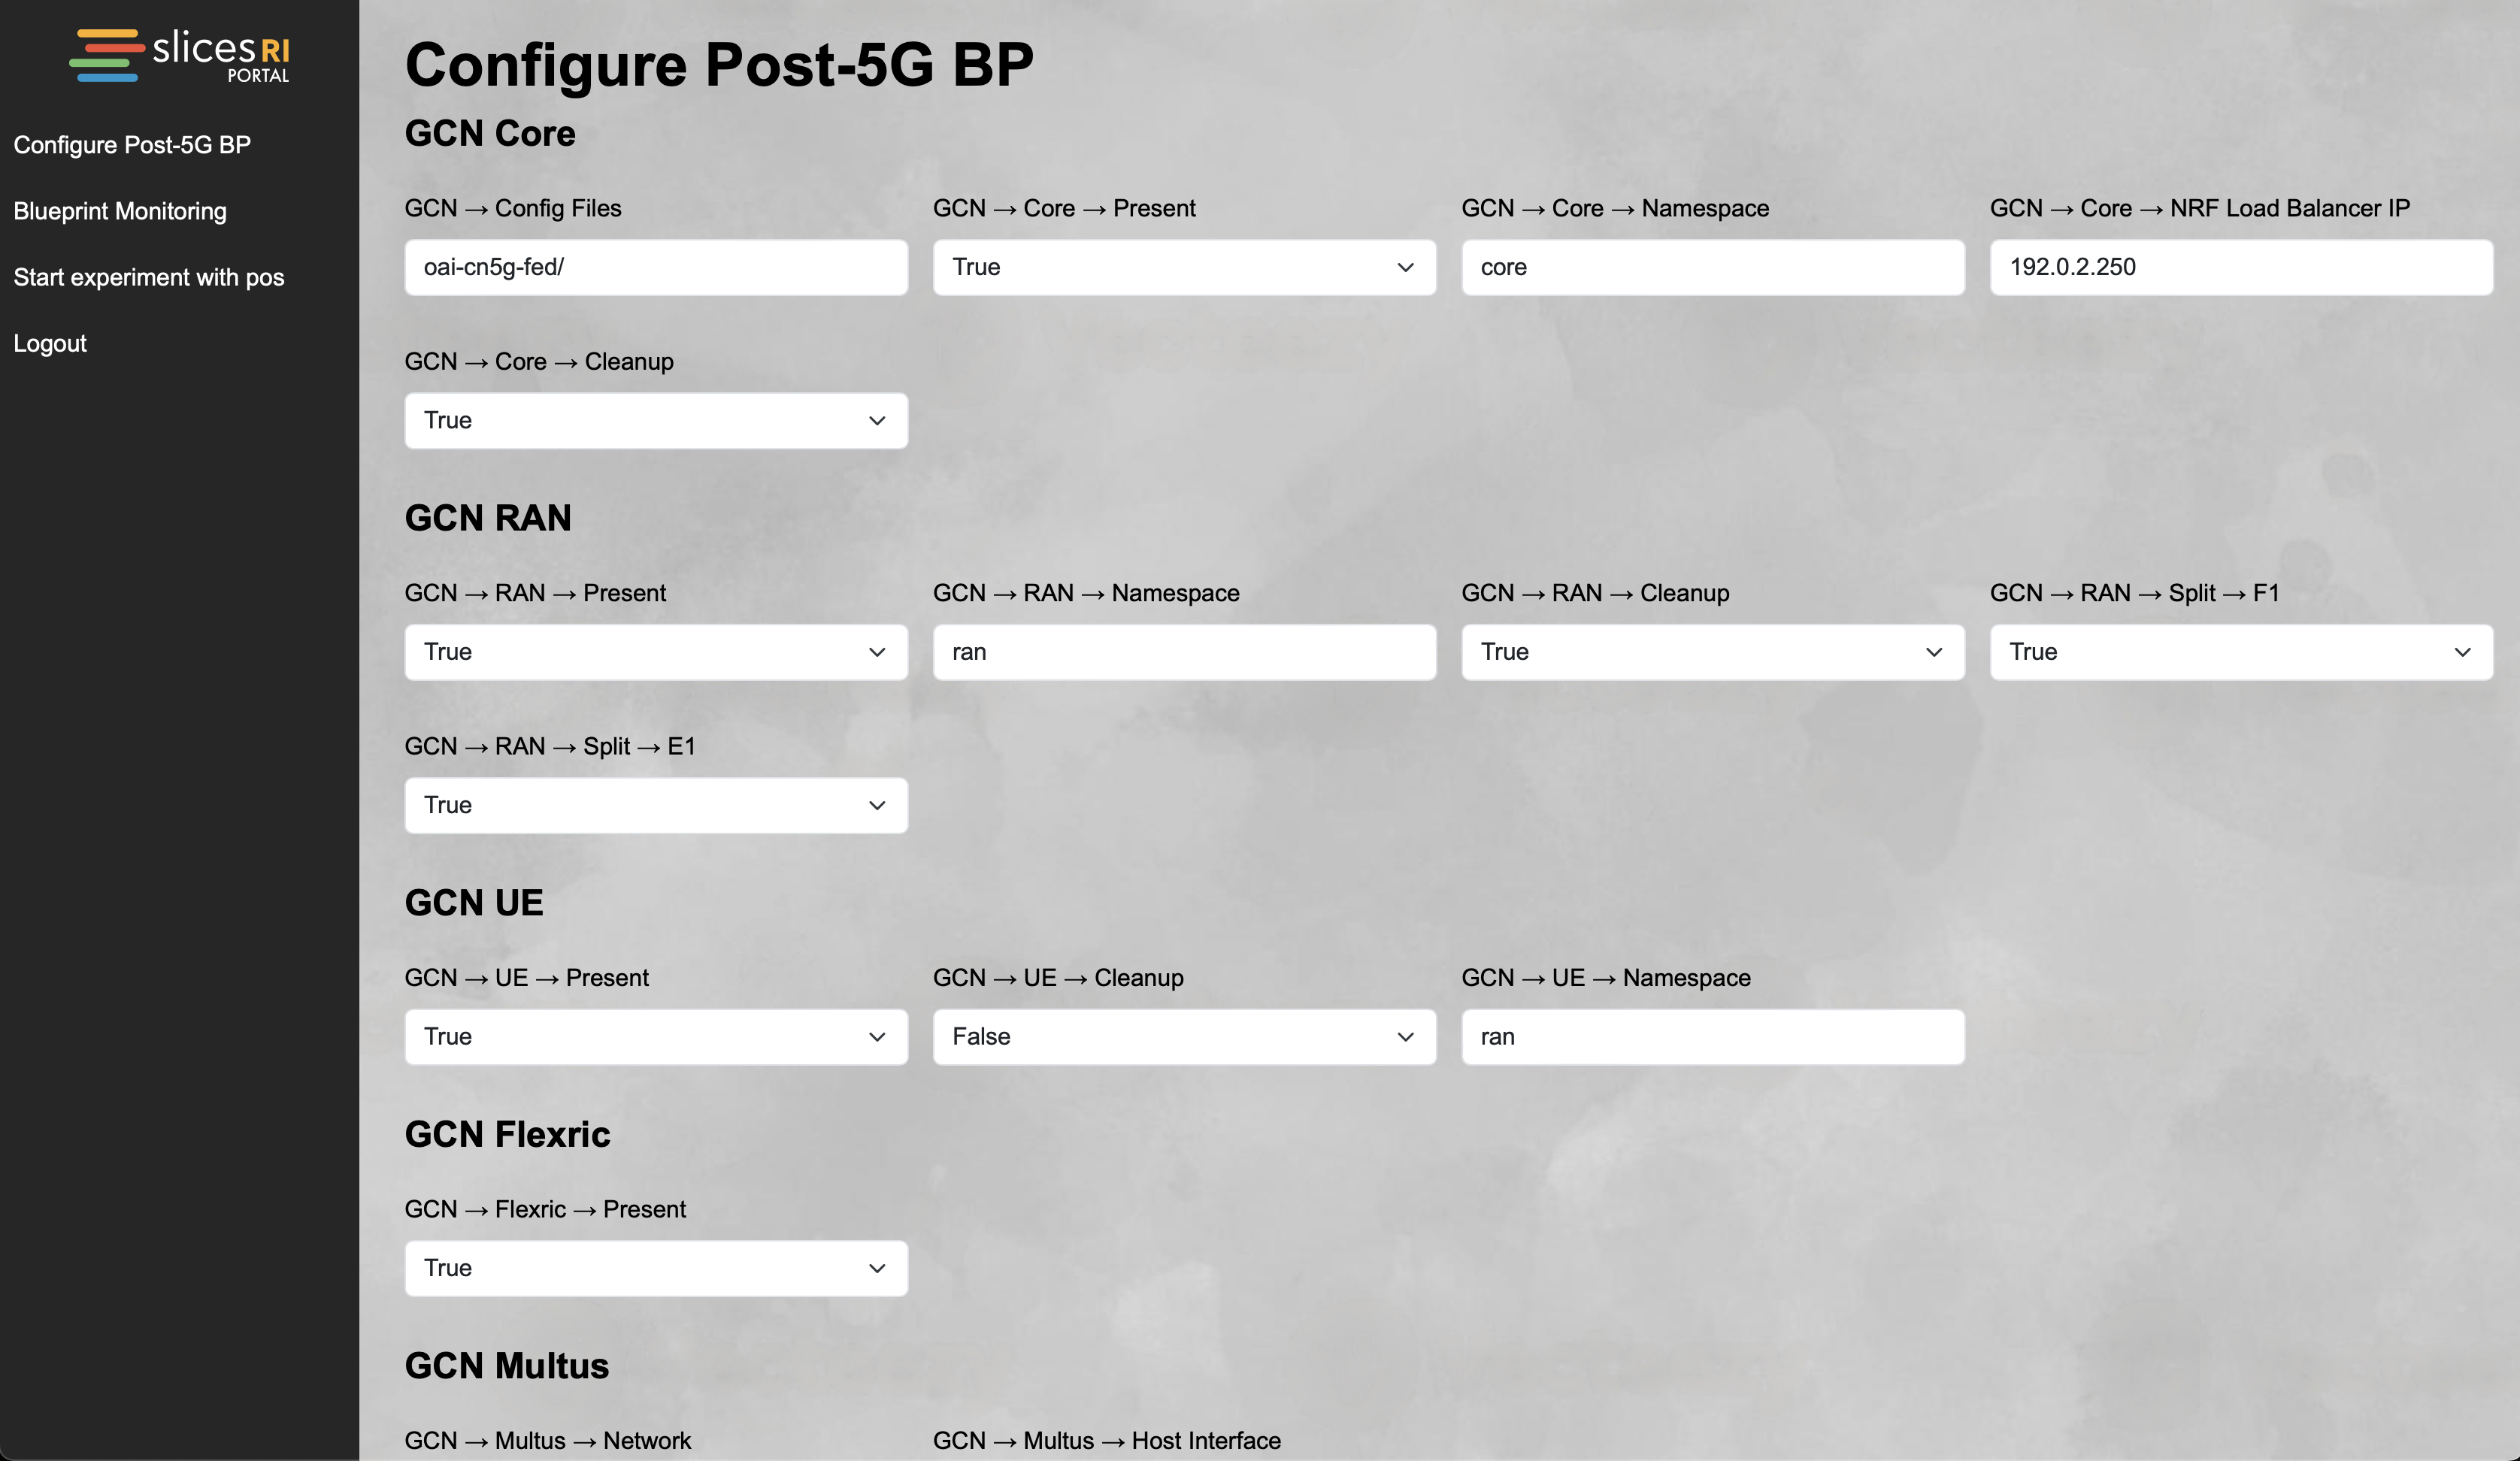
In the assistant, make sure the check the GCN FlexRIC is present, this will indicate to deploy the OpenAirInterface RIC in the network. To activate CU-DU split, check the F1 split. And to split the CU into CU-CP and CU-UP, check the E1 split. Indicate the load balancer IP received earlier in the NRF Load Balancer IP and the prefix in the Multus network field.
For this experiment, it is recommended to keep the remaining parameters at their default values, but specifically verify that the 5G core is configured with at least one DNN named oai, using IPv4 and the prefix 12.1.1.0/24. Provide the link https://gitlab.inria.fr/slices-ri/blueprints/post-5g/examples/-/archive/simple_ping/examples-simple_ping.tar.gz as experiment URL to tell the assistant how to retrieve the simple ping experiment script.
Step 2 - Experiment code generation
After configuring all the parameters in the assistant to suit your needs, click the Generate Experiment Code button. This will generate the OpenAirInterface configuration files along with the POS scripts, which will handle the provisioning of your experiment environment, including the 5G core infrastructure, the 5G RAN, and UE, and will execute the simple ping experiment.
Addresses for the N1, N2, N3, N4, N6, F1, and E1 interfaces are automatically taken from within the prefix you provided in the Multus network field.
You can verify that the experiment code was generated successfully by going to the My file IDs section of the Post-5G Blueprint Service, which logs the generation of experiment code.
In step 4, we will explain how to retrieve the generated code.
Step 3 - Book resources
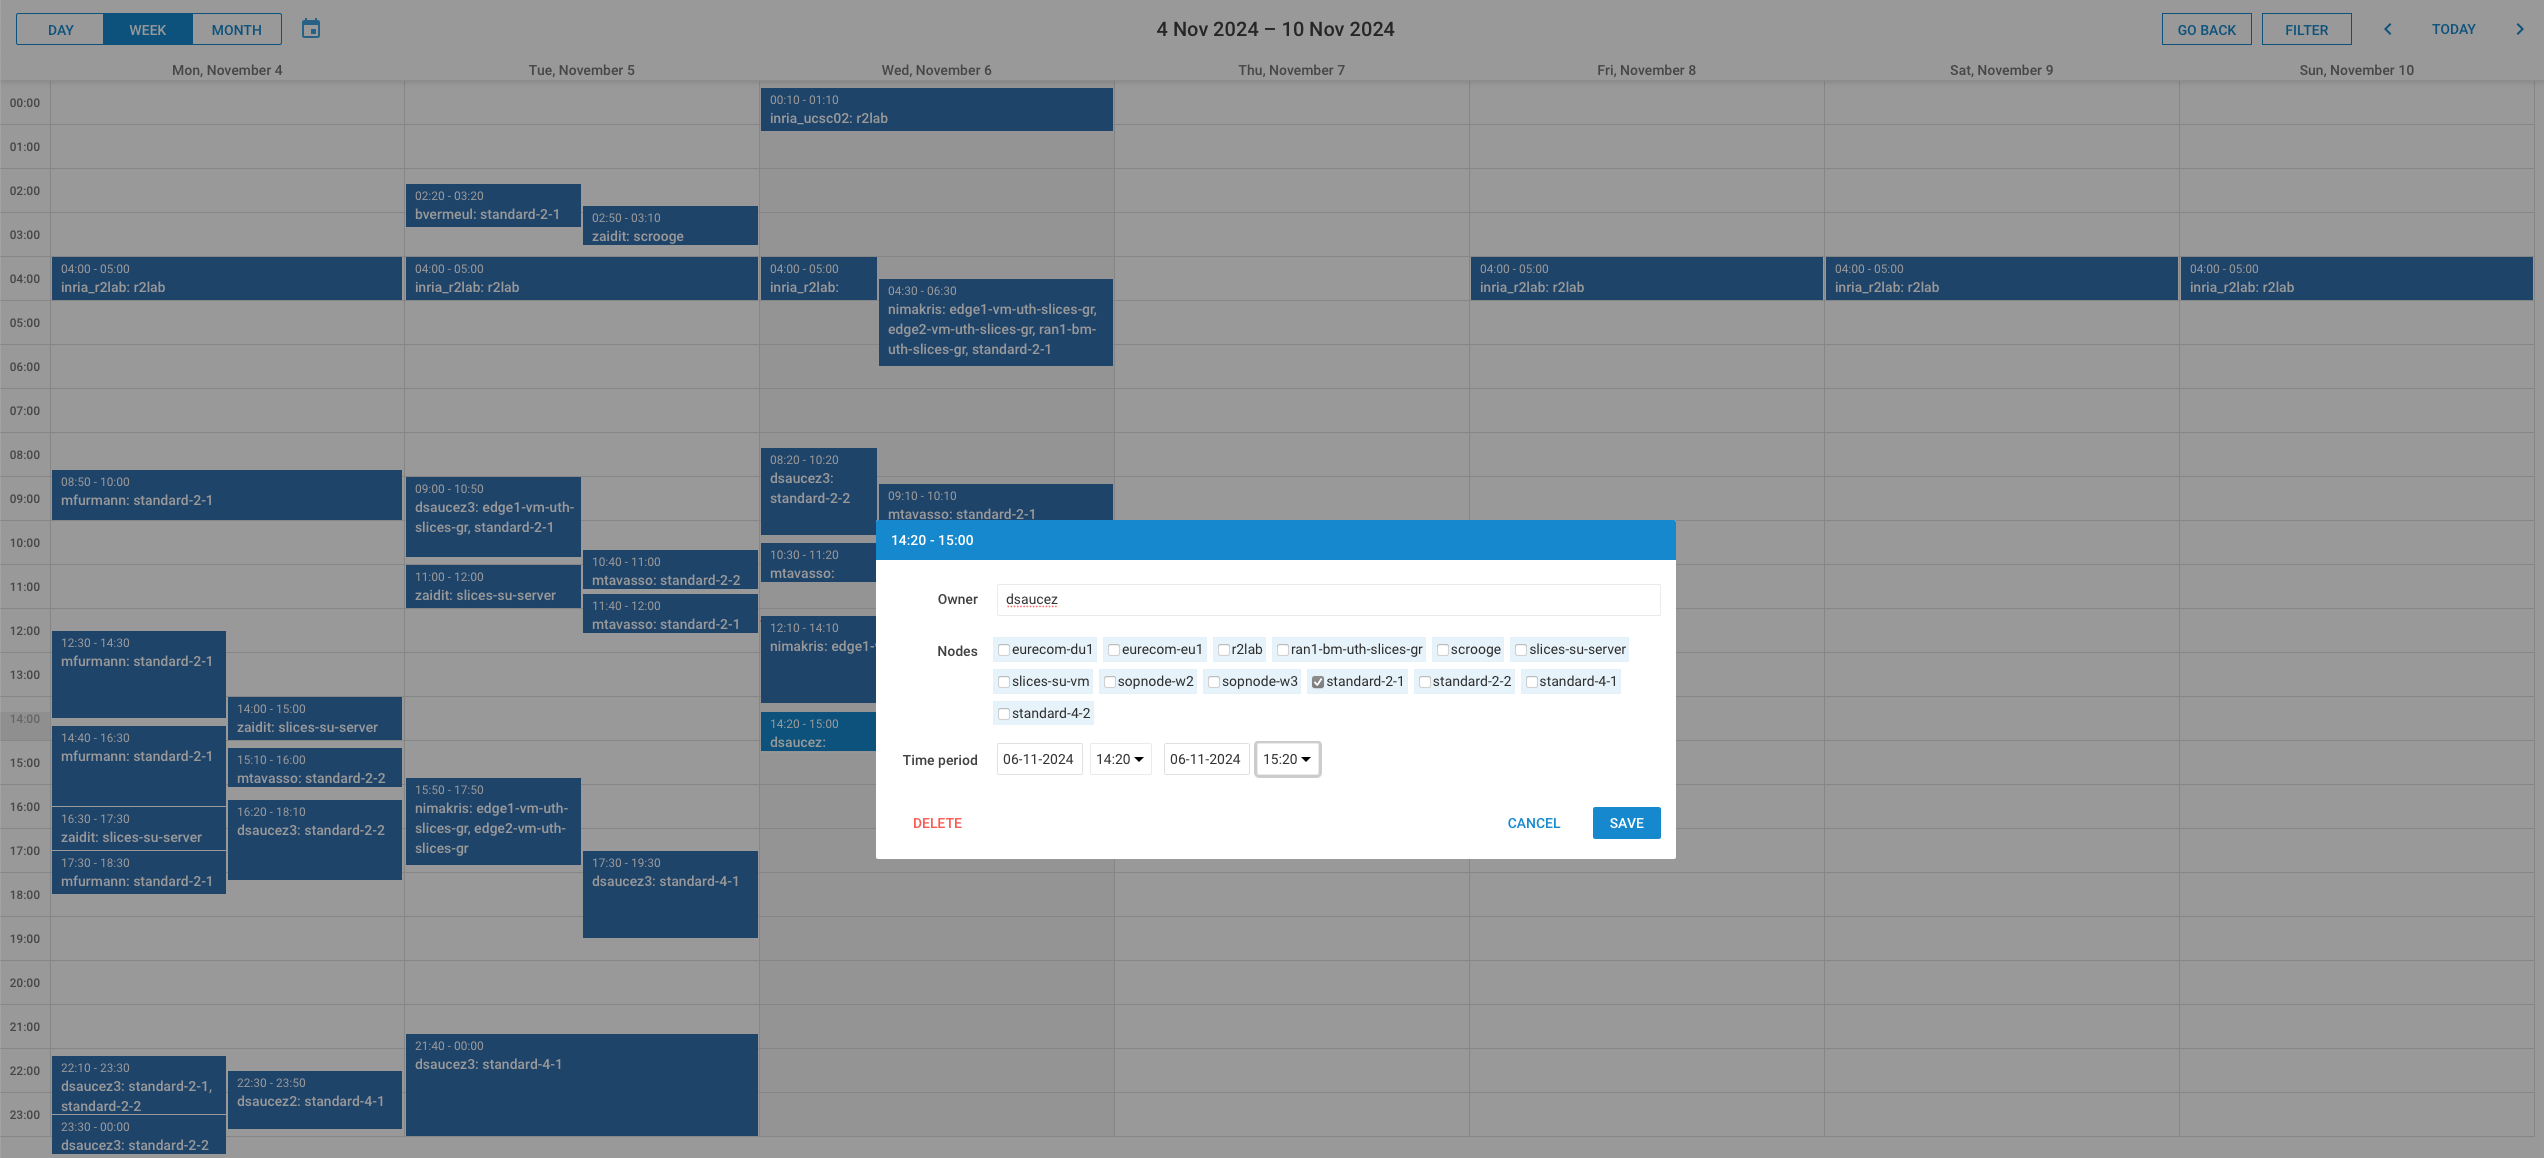
Now that you have created an experiment and generated its code, you can book the necessary resources to run it. Navigate to the POS Calendar section of the Post-5G Blueprint Service and select a one-hour time slot that fits your schedule. To add an entry to the calendar, either double-click on the desired time or click, hold, and drag the mouse over the time slot you wish to select.
In this tutorial, we are using the SLICES-RI Kubernetes cluster along with a deployment node (e.g., standard-2-1). The cluster is shared and does not require a reservation, but the deployment node must be reserved. Therefore, be sure to include the standard-2-1 resources in your reservation (obviously if you selected a different deployment node, select the one you intend to use). If the resource is already reserved by someone else for your chosen timeslot, you won’t be able to book it. In that case, you will need to select a different timeslot when the resource is available.
Make sure the selected time slot ends at or before the expiration of the SLICES experiment my_experiment you created in step 0. If you’re unsure of the time, you can retrieve it by running the following command in the POS Webshell.
slices experiment show my_experiment
See you in step 4!
Step 4 - Experiment execution
When your time slot begins, connect to the POS Webshell of the Post-5G Blueprint Service. First, you need to retrieve the experiment code generated in step 2 using the following command. You have to provide the SLICES experiment name that was used to generate the experiment (remember, we named it my_experiment).
post5g experiment get my_experiment
As a result, all experiment scripts and configurations are fetched by the POS orchestrator and saved in the xp/post5g-beta/my_experiment/ directory (since the experiment was created under the post5g-beta project). This directory contains a zip file bundling all automatically generated files for the experiment, organized into two folders:
oai-cn5g-fed: includes all automatically generated OpenAirInterface configuration files.pos: contains all the automatically generated files needed by pos.
Notably, the pos/deploy.sh script is used by POS to execute the experiment, and pos/params_dmi.yaml holds metadata for the experiment.
Next to this zip file is a directory named reference_implementation-develop, which holds the Post-5G blueprint reference implementation, in which the oai-cn5g-fed and pos directories presented above are included.
Feel free to review the contents of the reference_implementation-develop folder and adjust the files as needed. If necessary, you can check the pos/params.5g.yaml file to see the IP addresses assigned to the various Multus interfaces. However, note that modifying these addresses in this file will not affect the OpenAirInterface configuration files, as the parameter file only reflects the settings used to generate those configuration files. If you wish to change them manually, be sure to update both the pos/params.5g.yaml file and the relevant configuration files in the oai-cn5g-fed directory.
Notes: For reproducibility reasons we made the choice of providing all the scripts and make them part of the experiment itself
Note: Experiments are potentially long processes during which you may loose (or pause) the connection to the webshell. We recommend protecting your work sessions within the webshell from disconnection by using tools like tmux.
When the experiment code generated data is fetched, you can launch the experiment by running the following command from the webshell.
post5g experiment launch my_experiment
In practice, this command calls the deploy.sh script that is located in xp/post5g-beta/my_experiment/reference_implementation-develop/pos/ that runs the experiment in the SLICES infrastructure.
The experiment will run, with progress displayed in the output as shown below and published to the MRS.
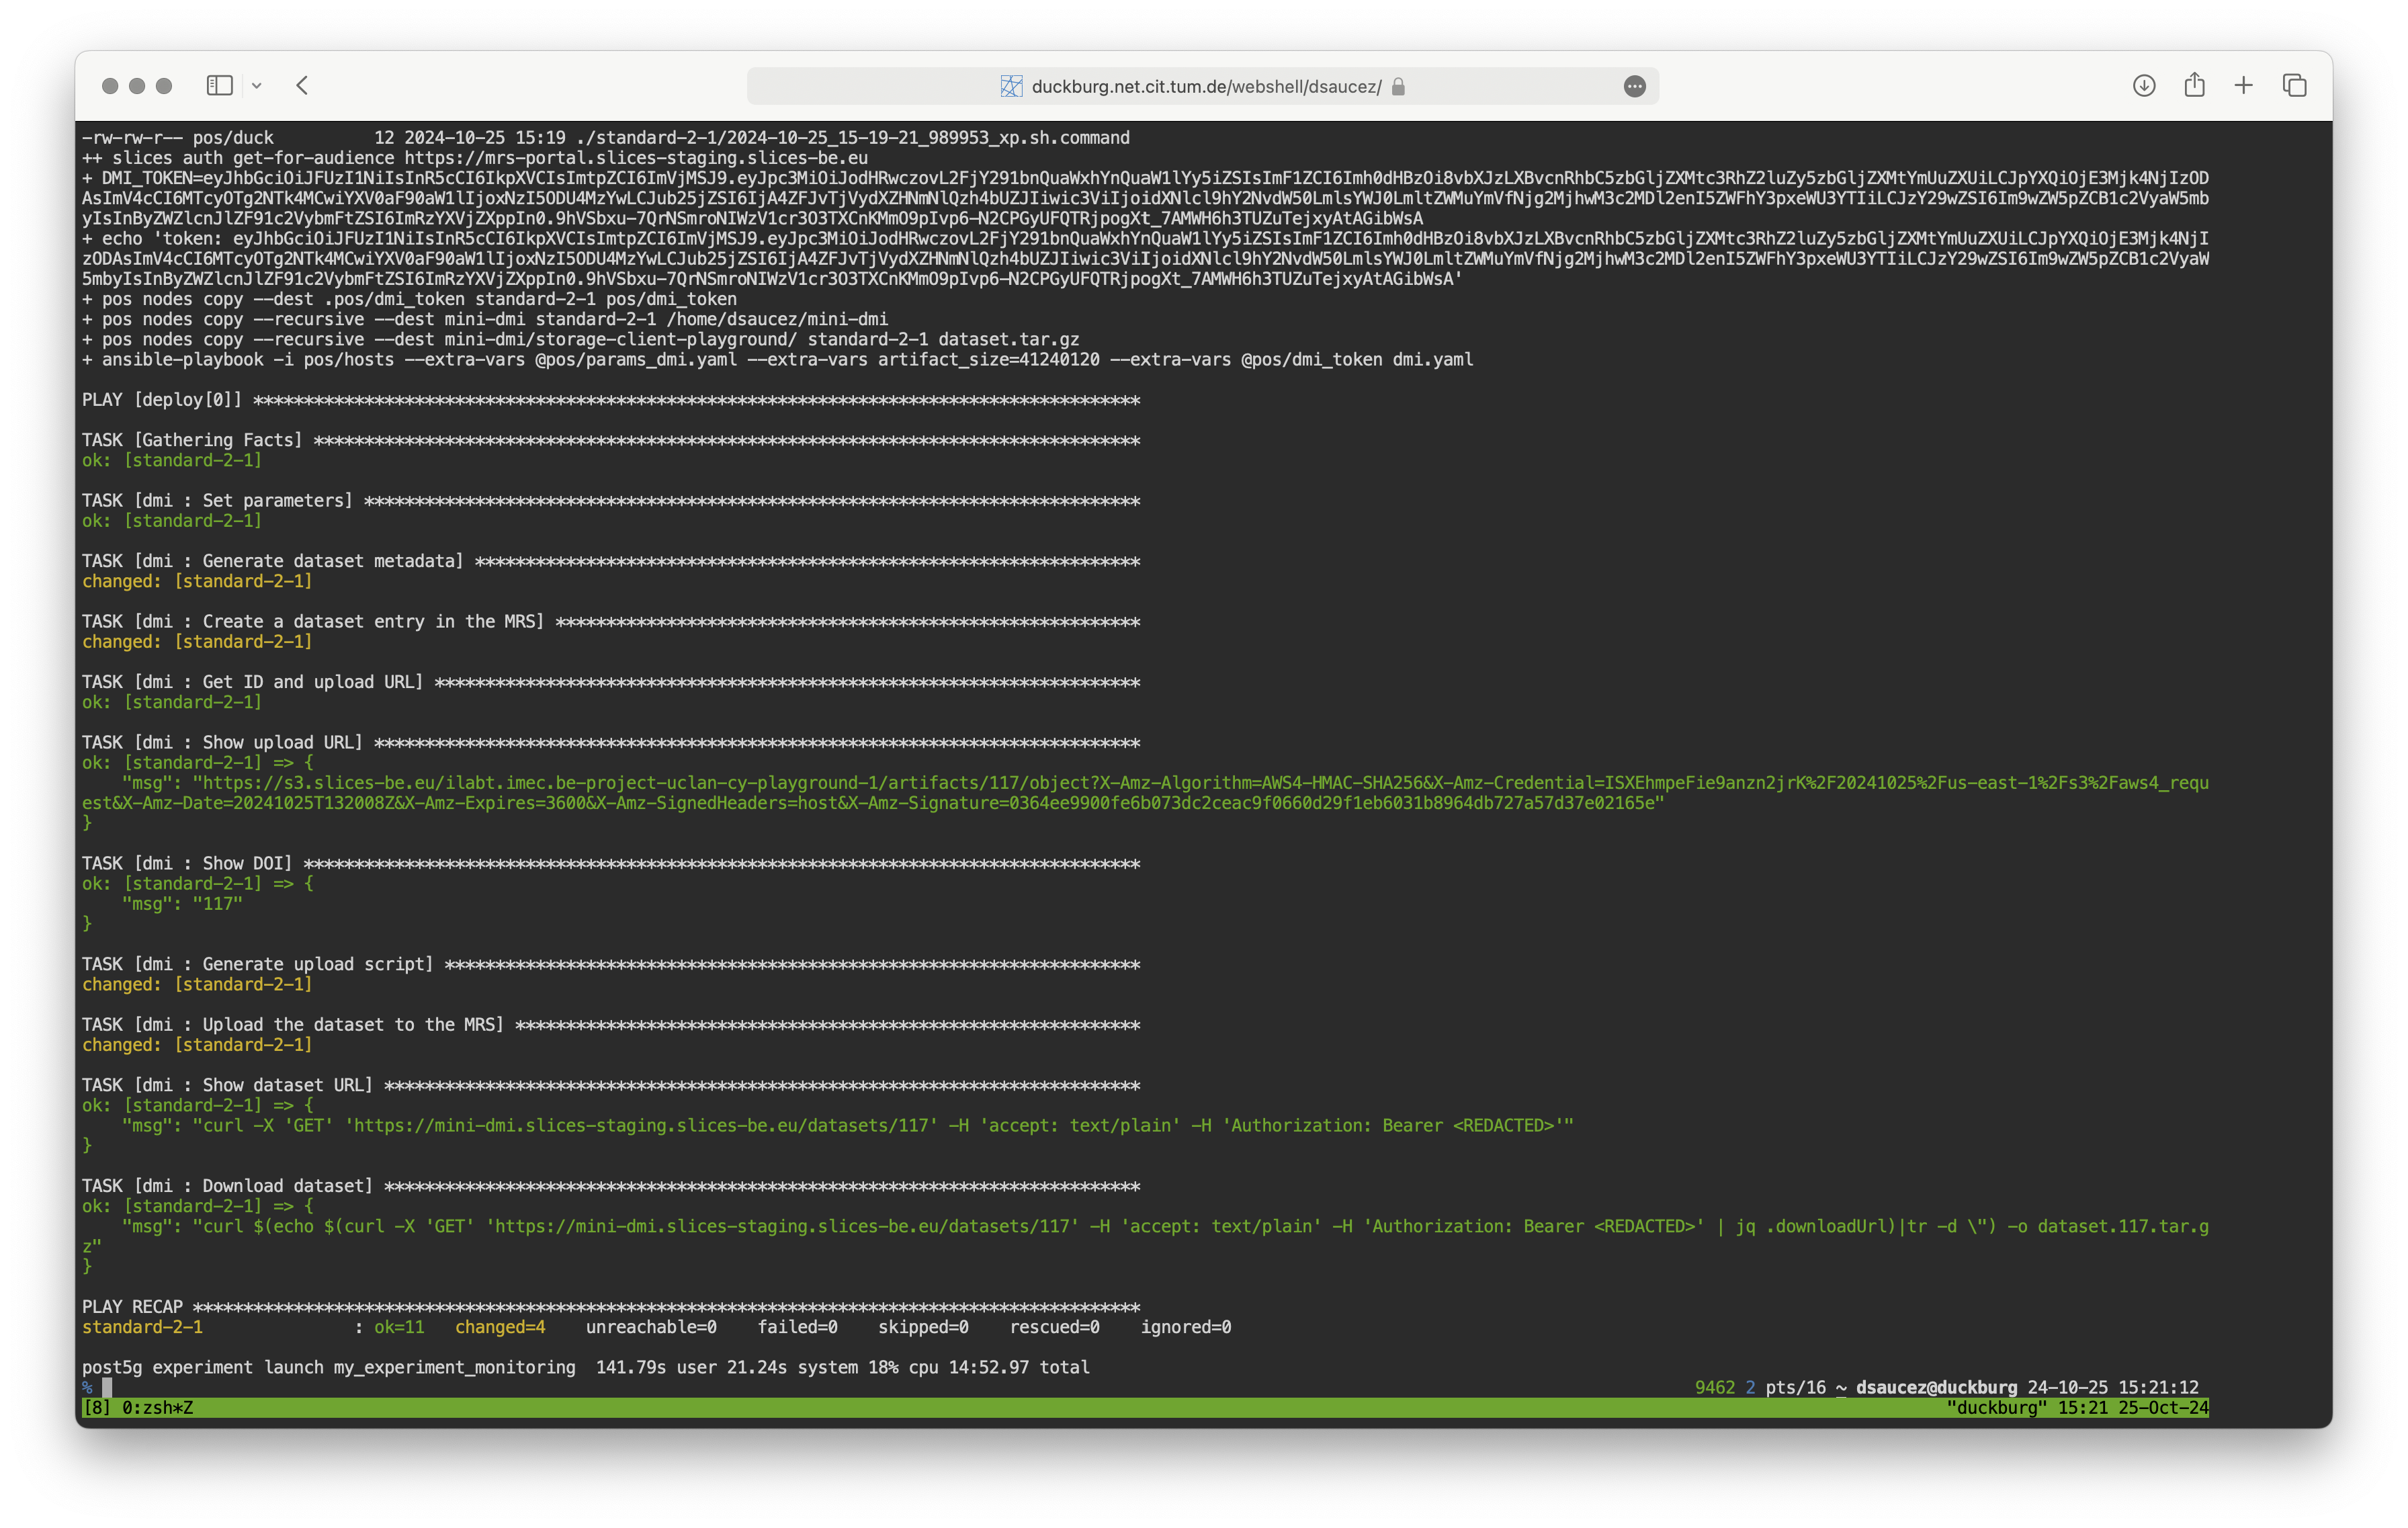
NOTE: The experiment takes a significant amount of time, primarily due to the provisioning of the deployment node. To ensure reproducibility and guarantee idempotence, the node is initialized from scratch and provisioned with all necessary dependencies each time the experiment is run. However, deploying the 5G infrastructure and executing the ping experiment itself is relatively quick. We are currently working on a solution to speed up the provisioning.
Step 5 - Results publication
Experimental data and metadata are published to the SLICES MRS and SLICES Data Management Infrastructure (DMI) only if the experiment completes successfully. In case of an error, the experiment is not published, and it is up to you to debug it. Although it might seem convenient to publish all experimental results, even partial ones, doing so would compromise methodological rigor. By publishing only successful experiments, we ensure that all experiments published by the service are, at a least, syntactically correct (though this does not guarantee the correctness of the results).
If the whole process is successful, the Dataset ID of the published data will appear in the output (e.g., 117 as shown above). To review the information published in the MRS. Go to the MRS section of the Post-5G Blueprint Service and provide the Dataset ID you just obtained you should obtain something similar to what is shown below.
Move in the different meta-data tabs to see various information about your experiment.
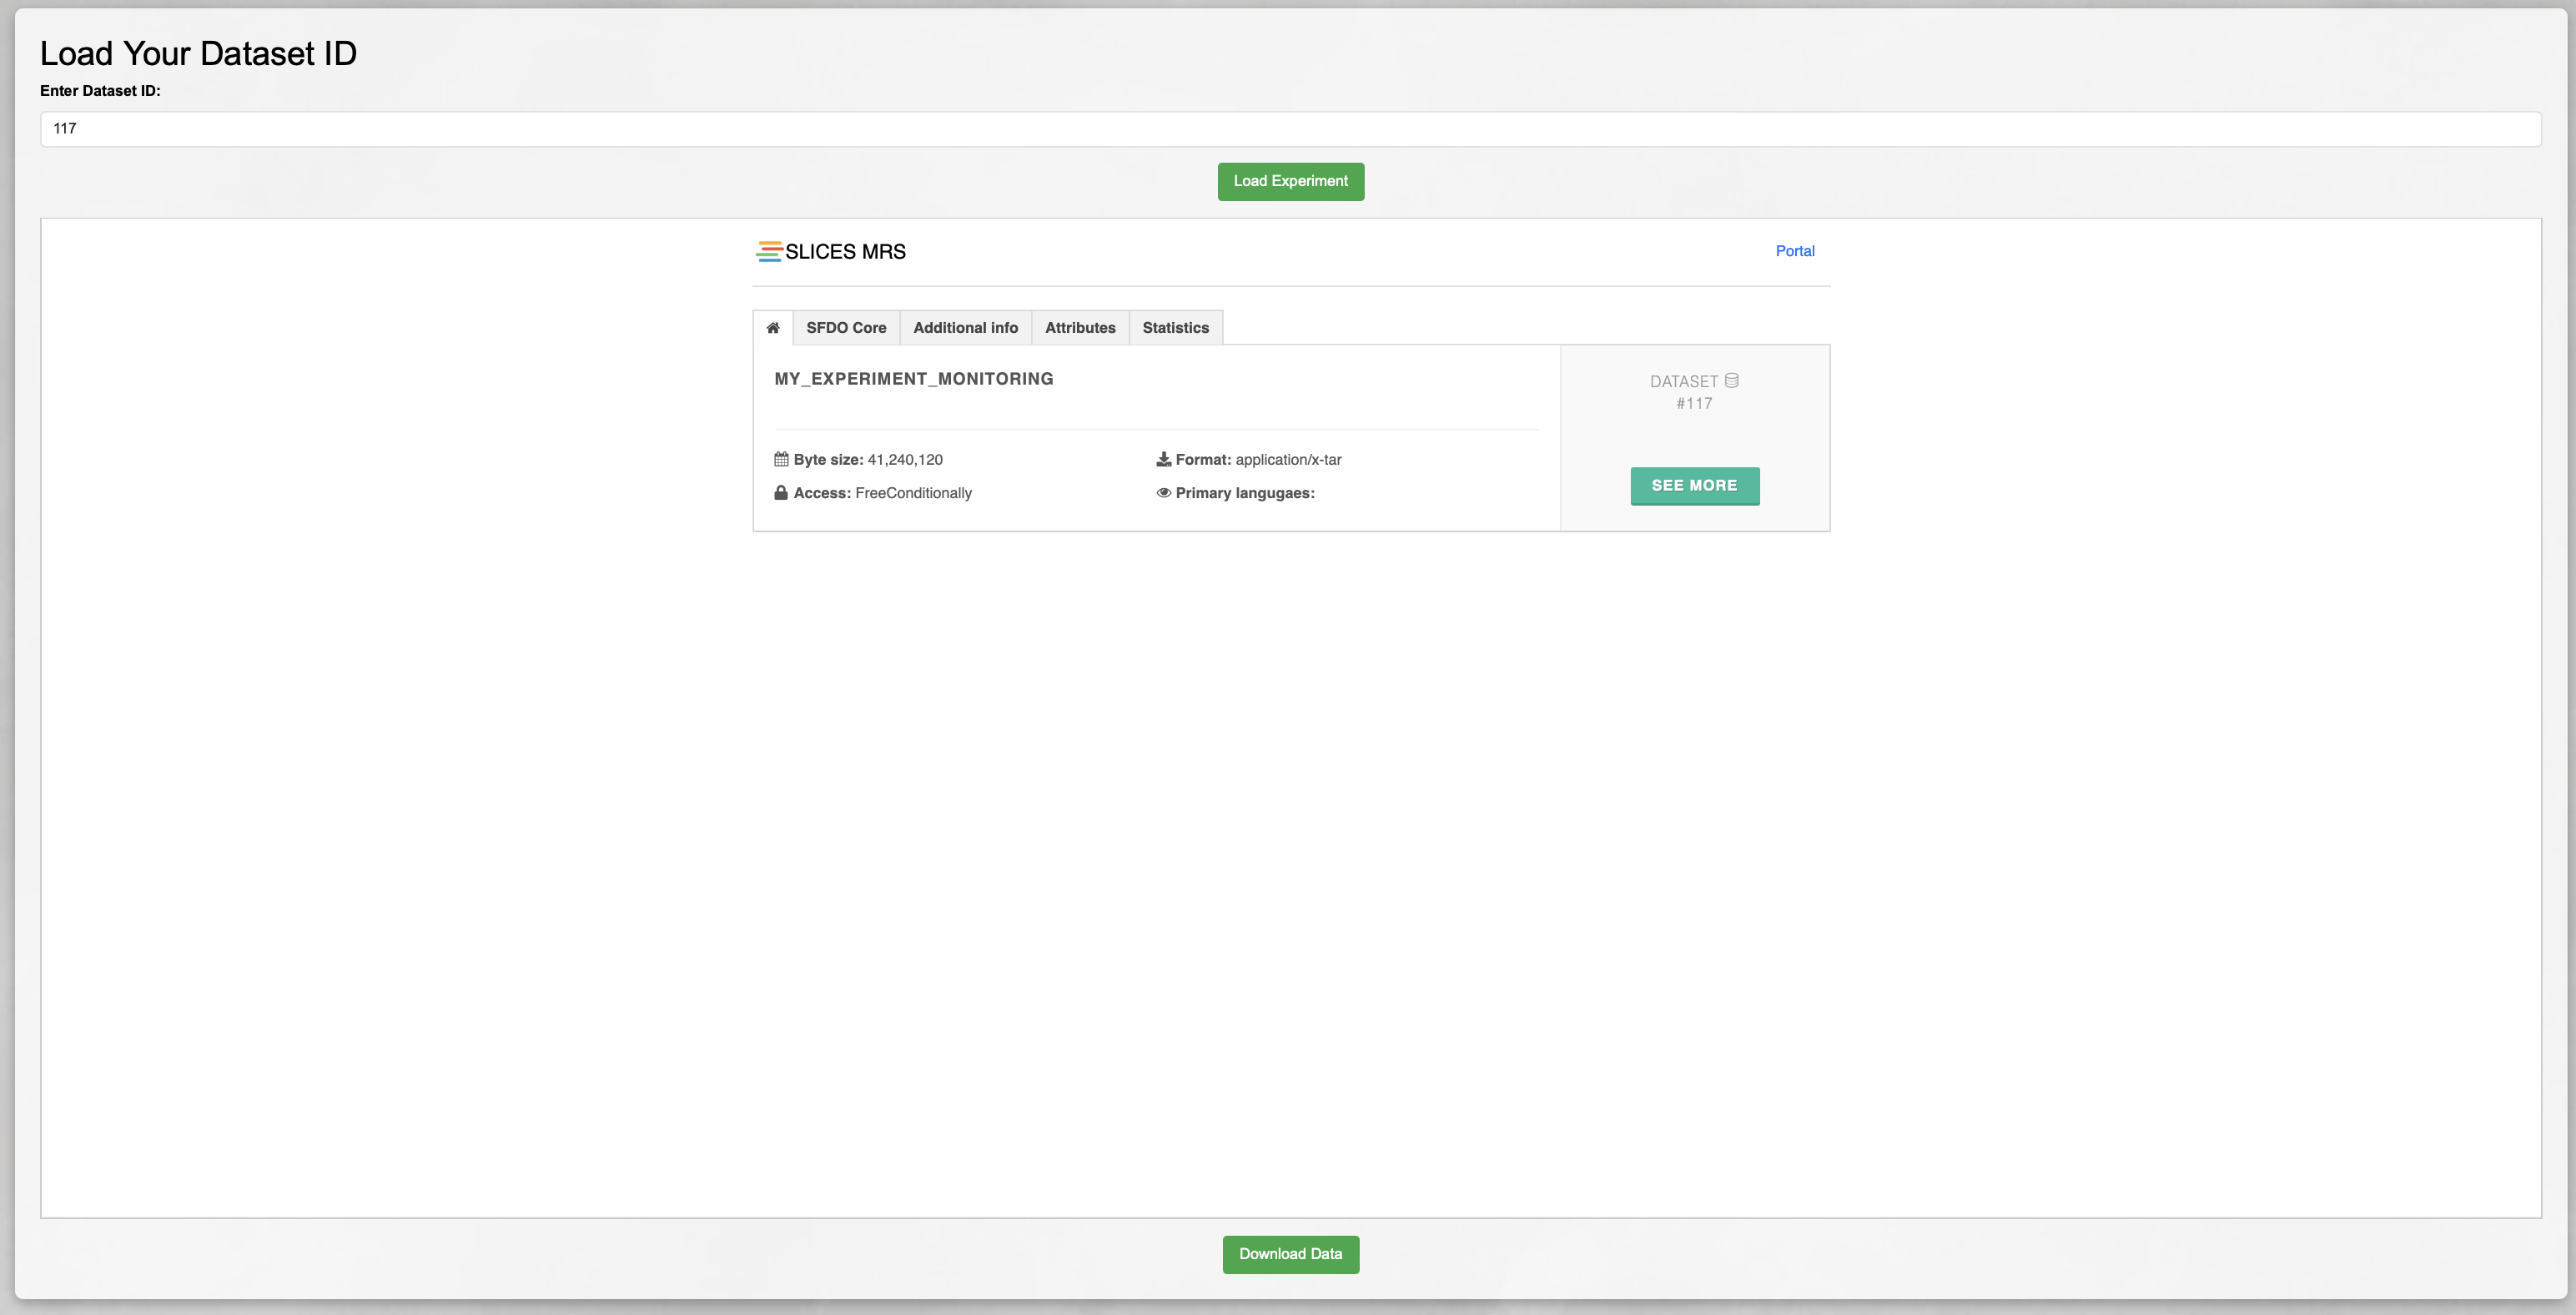
You can also connect directly to the MRS Portal to access this information. In this case, you can find your dataset in the MRS using the MRS search engine. For example, the dataset name is set to the experiment name (e.g., my_experiment); the Identifier is set to the SLICES experiment ID, which you can find in the My file IDs section of the Post-5G Blueprint Service; and the Internal Identifier matches the Dataset ID shown at the end of the experiment execution. You can find more information about the MRS here.
The MRS ensures that experiment results adhere to FAIR data principles [4], with the actual data stored in the SLICES DMI. To retrieve this data, simply click the Download Data button. The data is packaged as a tar.gz file, which you can verify through the format and compressionFormat metadata in the MRS. Depending on your browser, you may need to add the .tar.gz extension to the downloaded file.
You could also directly use the DMI API to access the dataset, but this is out of the scope of this tutorial.
Download the file and decompress it (e.g., using tar -xzf dataset.tar.gz). Assuming that your deployement node was standard-2-1, the tarball is structured as follows:
.
├── config
├── energy
├── reference_implementation-develop
├── standard-2-1
│   ├── ...
│   └── results
└── setup
The config, energy, and setup folders are related to the POS setup used. While they are not directly relevant to the experiment itself, they are very useful for reproducibility as they provide information about the POS environment in which the experiment was executed.
The reference_implementation-develop folder is a snapshot of the xp/post5g-beta/my_experiment/reference_implementation-develop at the pos Webshell (see step 4 for details) at the exact moment the experiment was launched (i.e., when you ran post5g experiment launch my_experiment). The reason for capturing this snapshot is that it ensures we have the exact scripts used to conduct the experiment, so you don’t need to worry about which scripts were used if you made changes or lost them later.
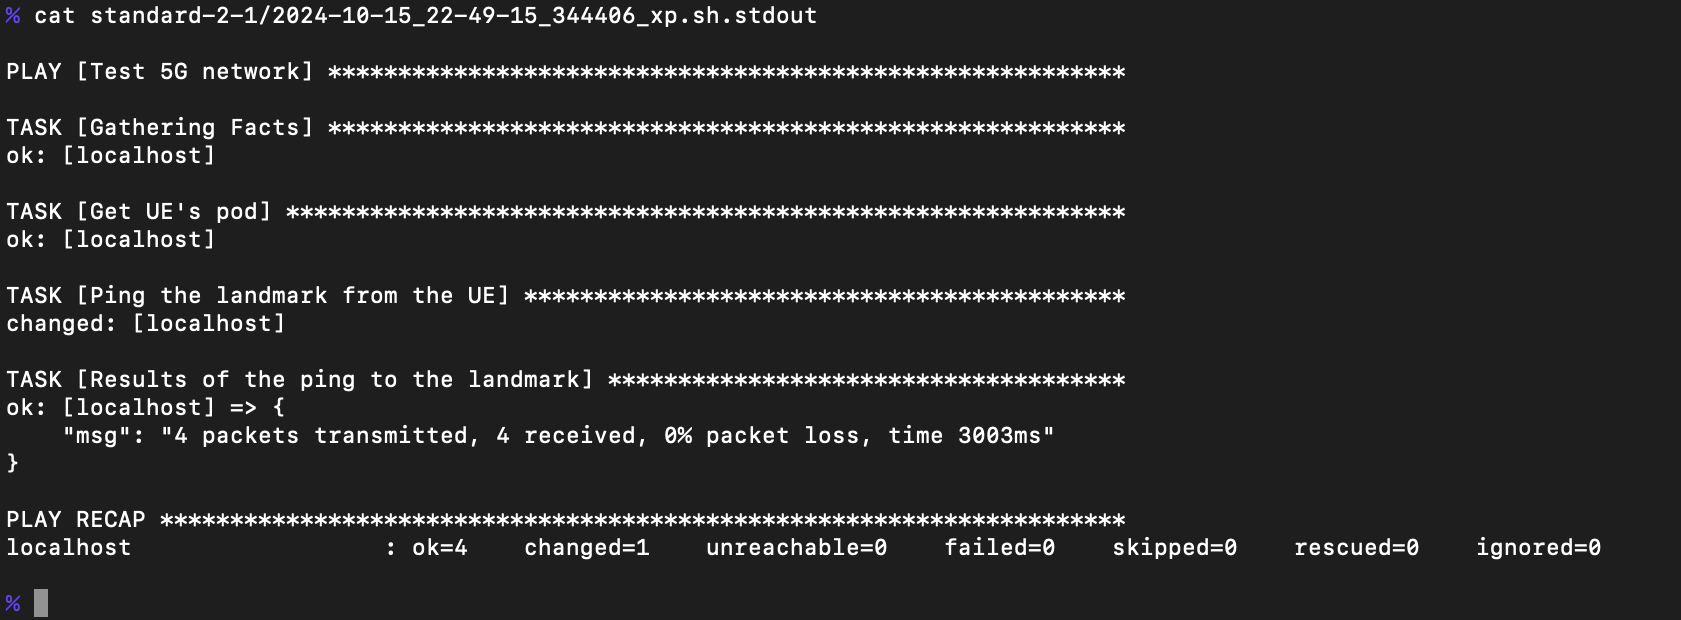
The standard-2-1 folder (replace the name with the actual deployment node you used) contains files with .status, .stderr, and .stdout extensions. These files represent the execution status as determined by POS (e.g., finished), the standard error output, and the standard output from the execution of the command, respectively. The prefix of each file indicates the date when the command was executed by POS. Each file corresponds to a command executed by POS during the experiment. Most of these files are not directly related to the experiment itself, except for the <date>_xp.sh.stderr and <date>_xp.sh.stdout files, which contain the full standard error and standard output of the execution of your xp.sh script. Check the <date>_xp.sh.stdout file to view the results of the ping. If everything went as expected, you should see a success rate of 100%, as shown below (refer to step 1 if you need a reminder of the experiment’s definition).
The results subfolder is a copy of the ~/results folder from the deployment node taken immediately after the successful execution of xp.sh (refer to step 1 for a reminder).
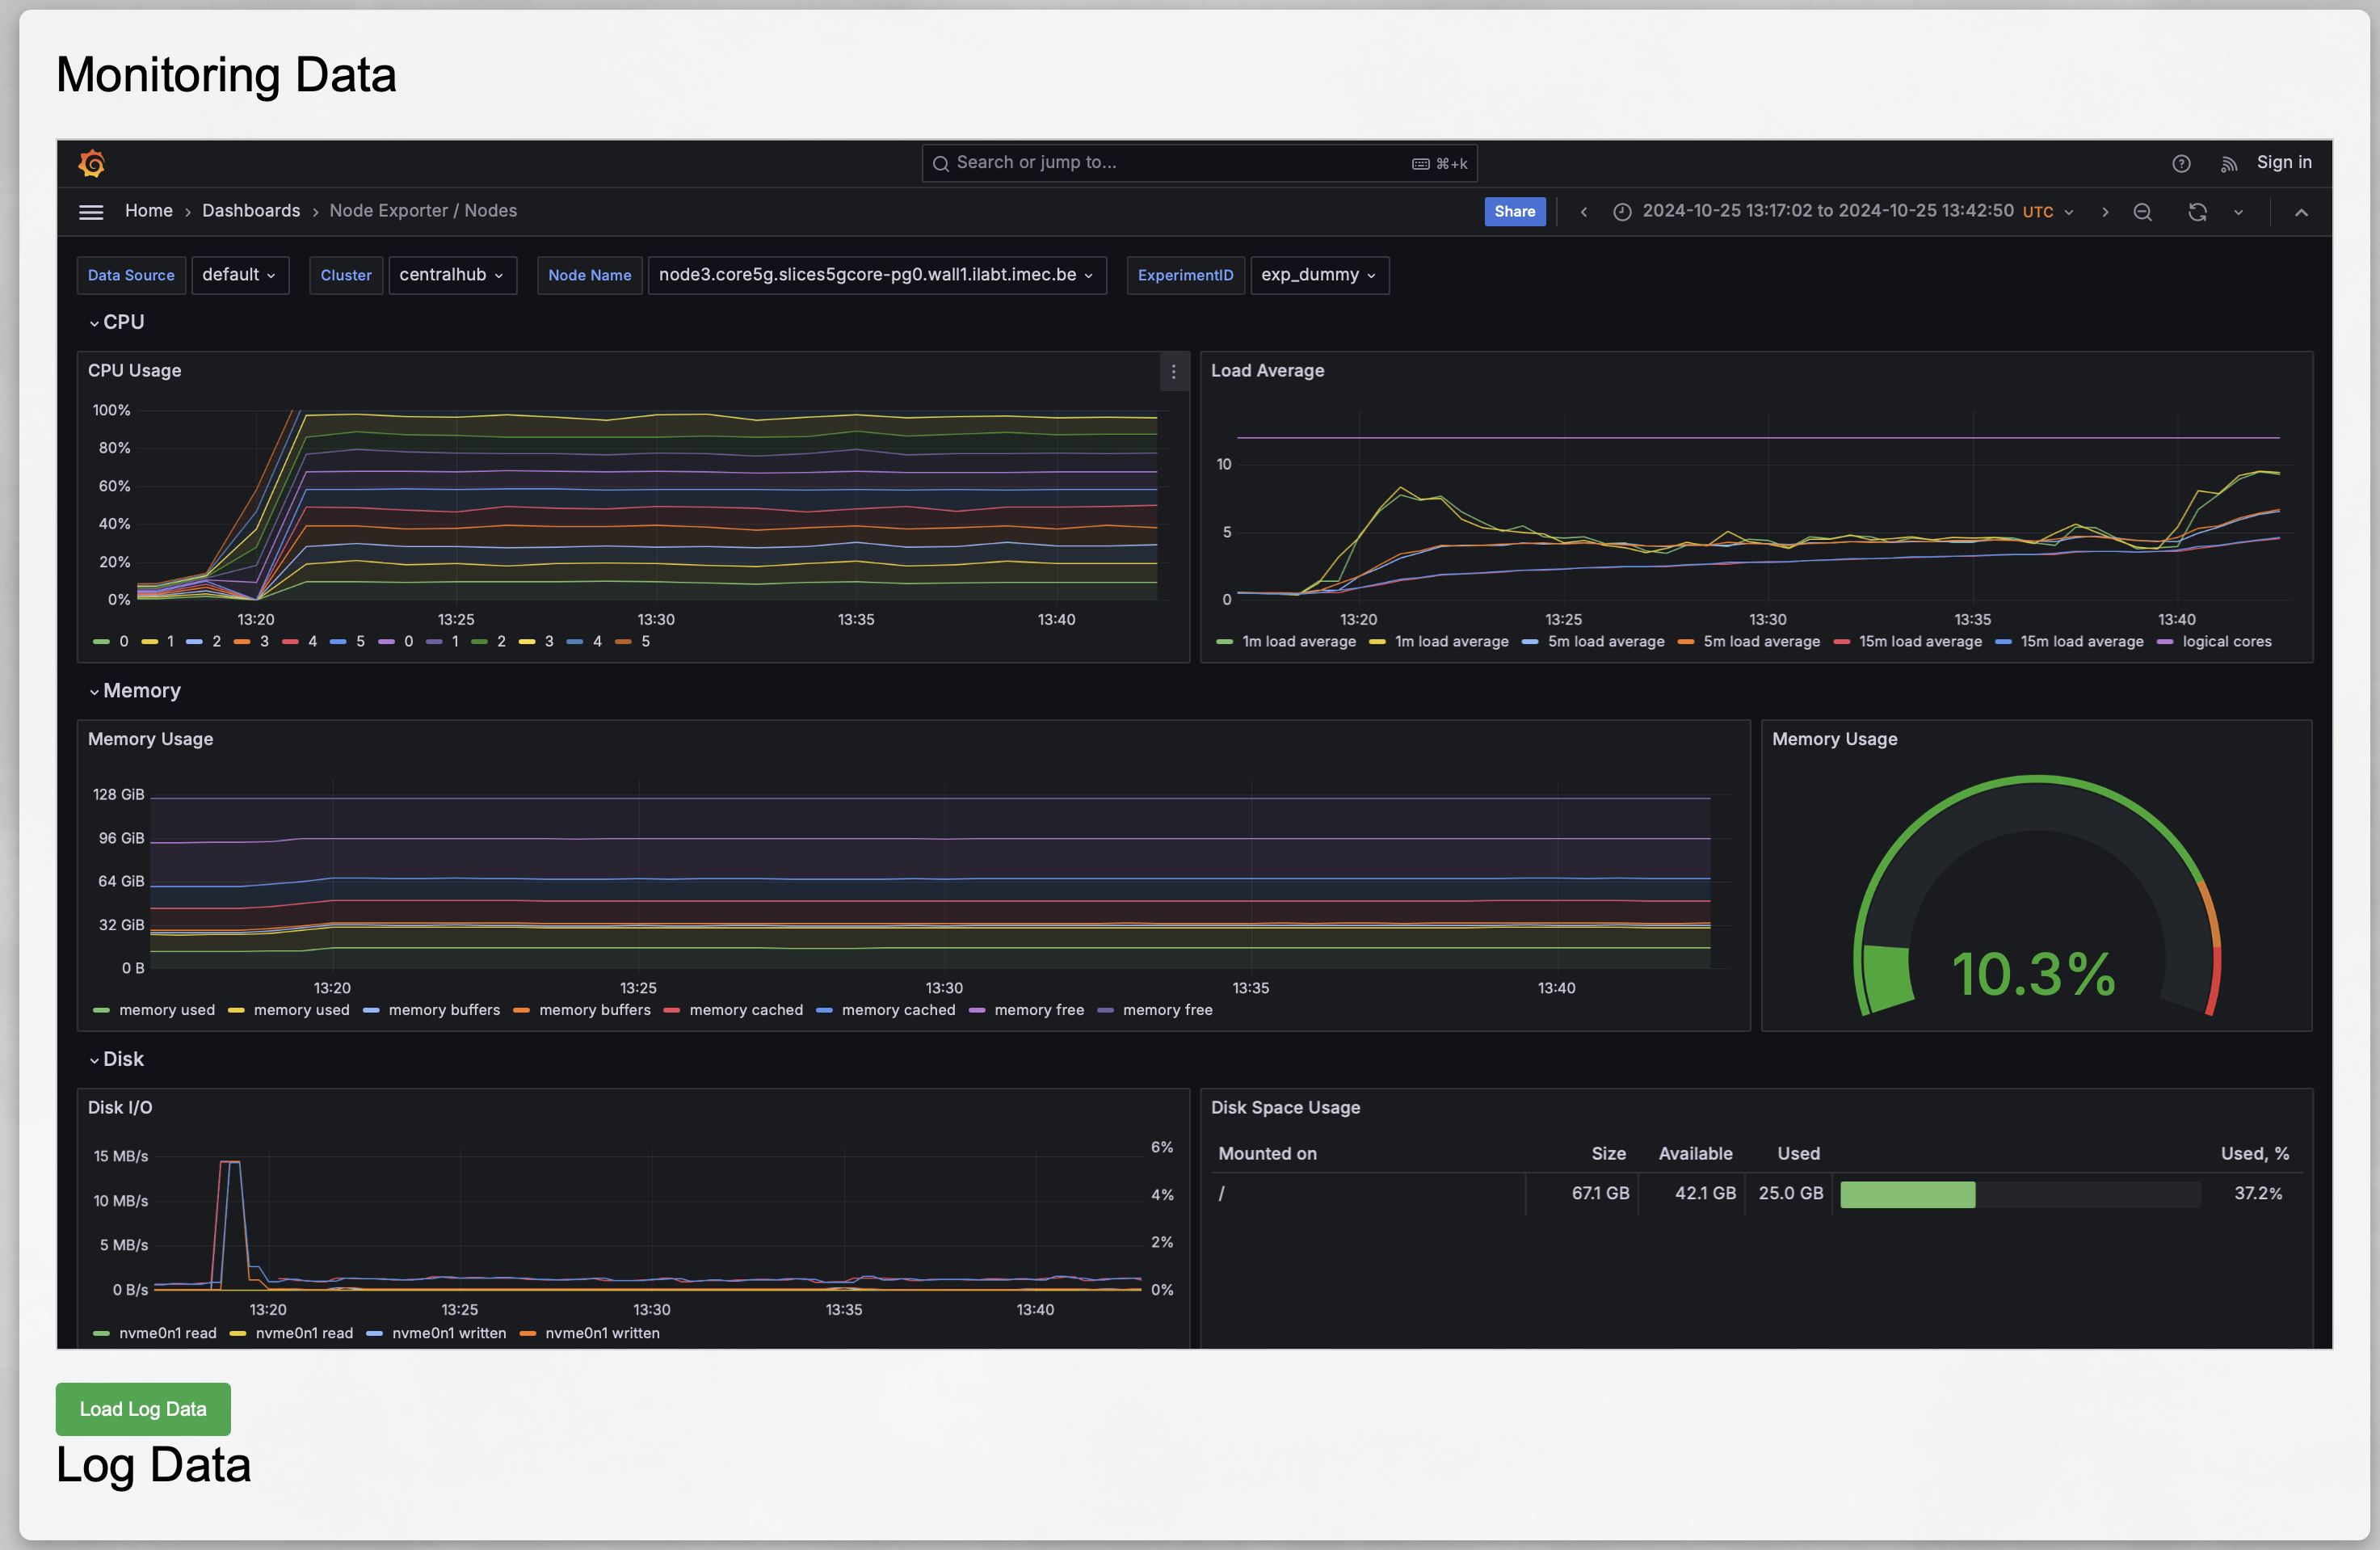
The SLICES platform is designed around open, reproducible experiments. The SLICES-RI infrastructure collects background data, which you can explore via a deployed Grafana instance. Visit the Blueprint Monitoring section in the Post-5G Blueprint Service to access it. The initial dashboard provides an overview of the entire system; feel free to adjust the time range to match your experiment. You can determine the relevant timing details from the metadata published in the MRS (see the previous paragraphs). Your view might resemble the example shown below.
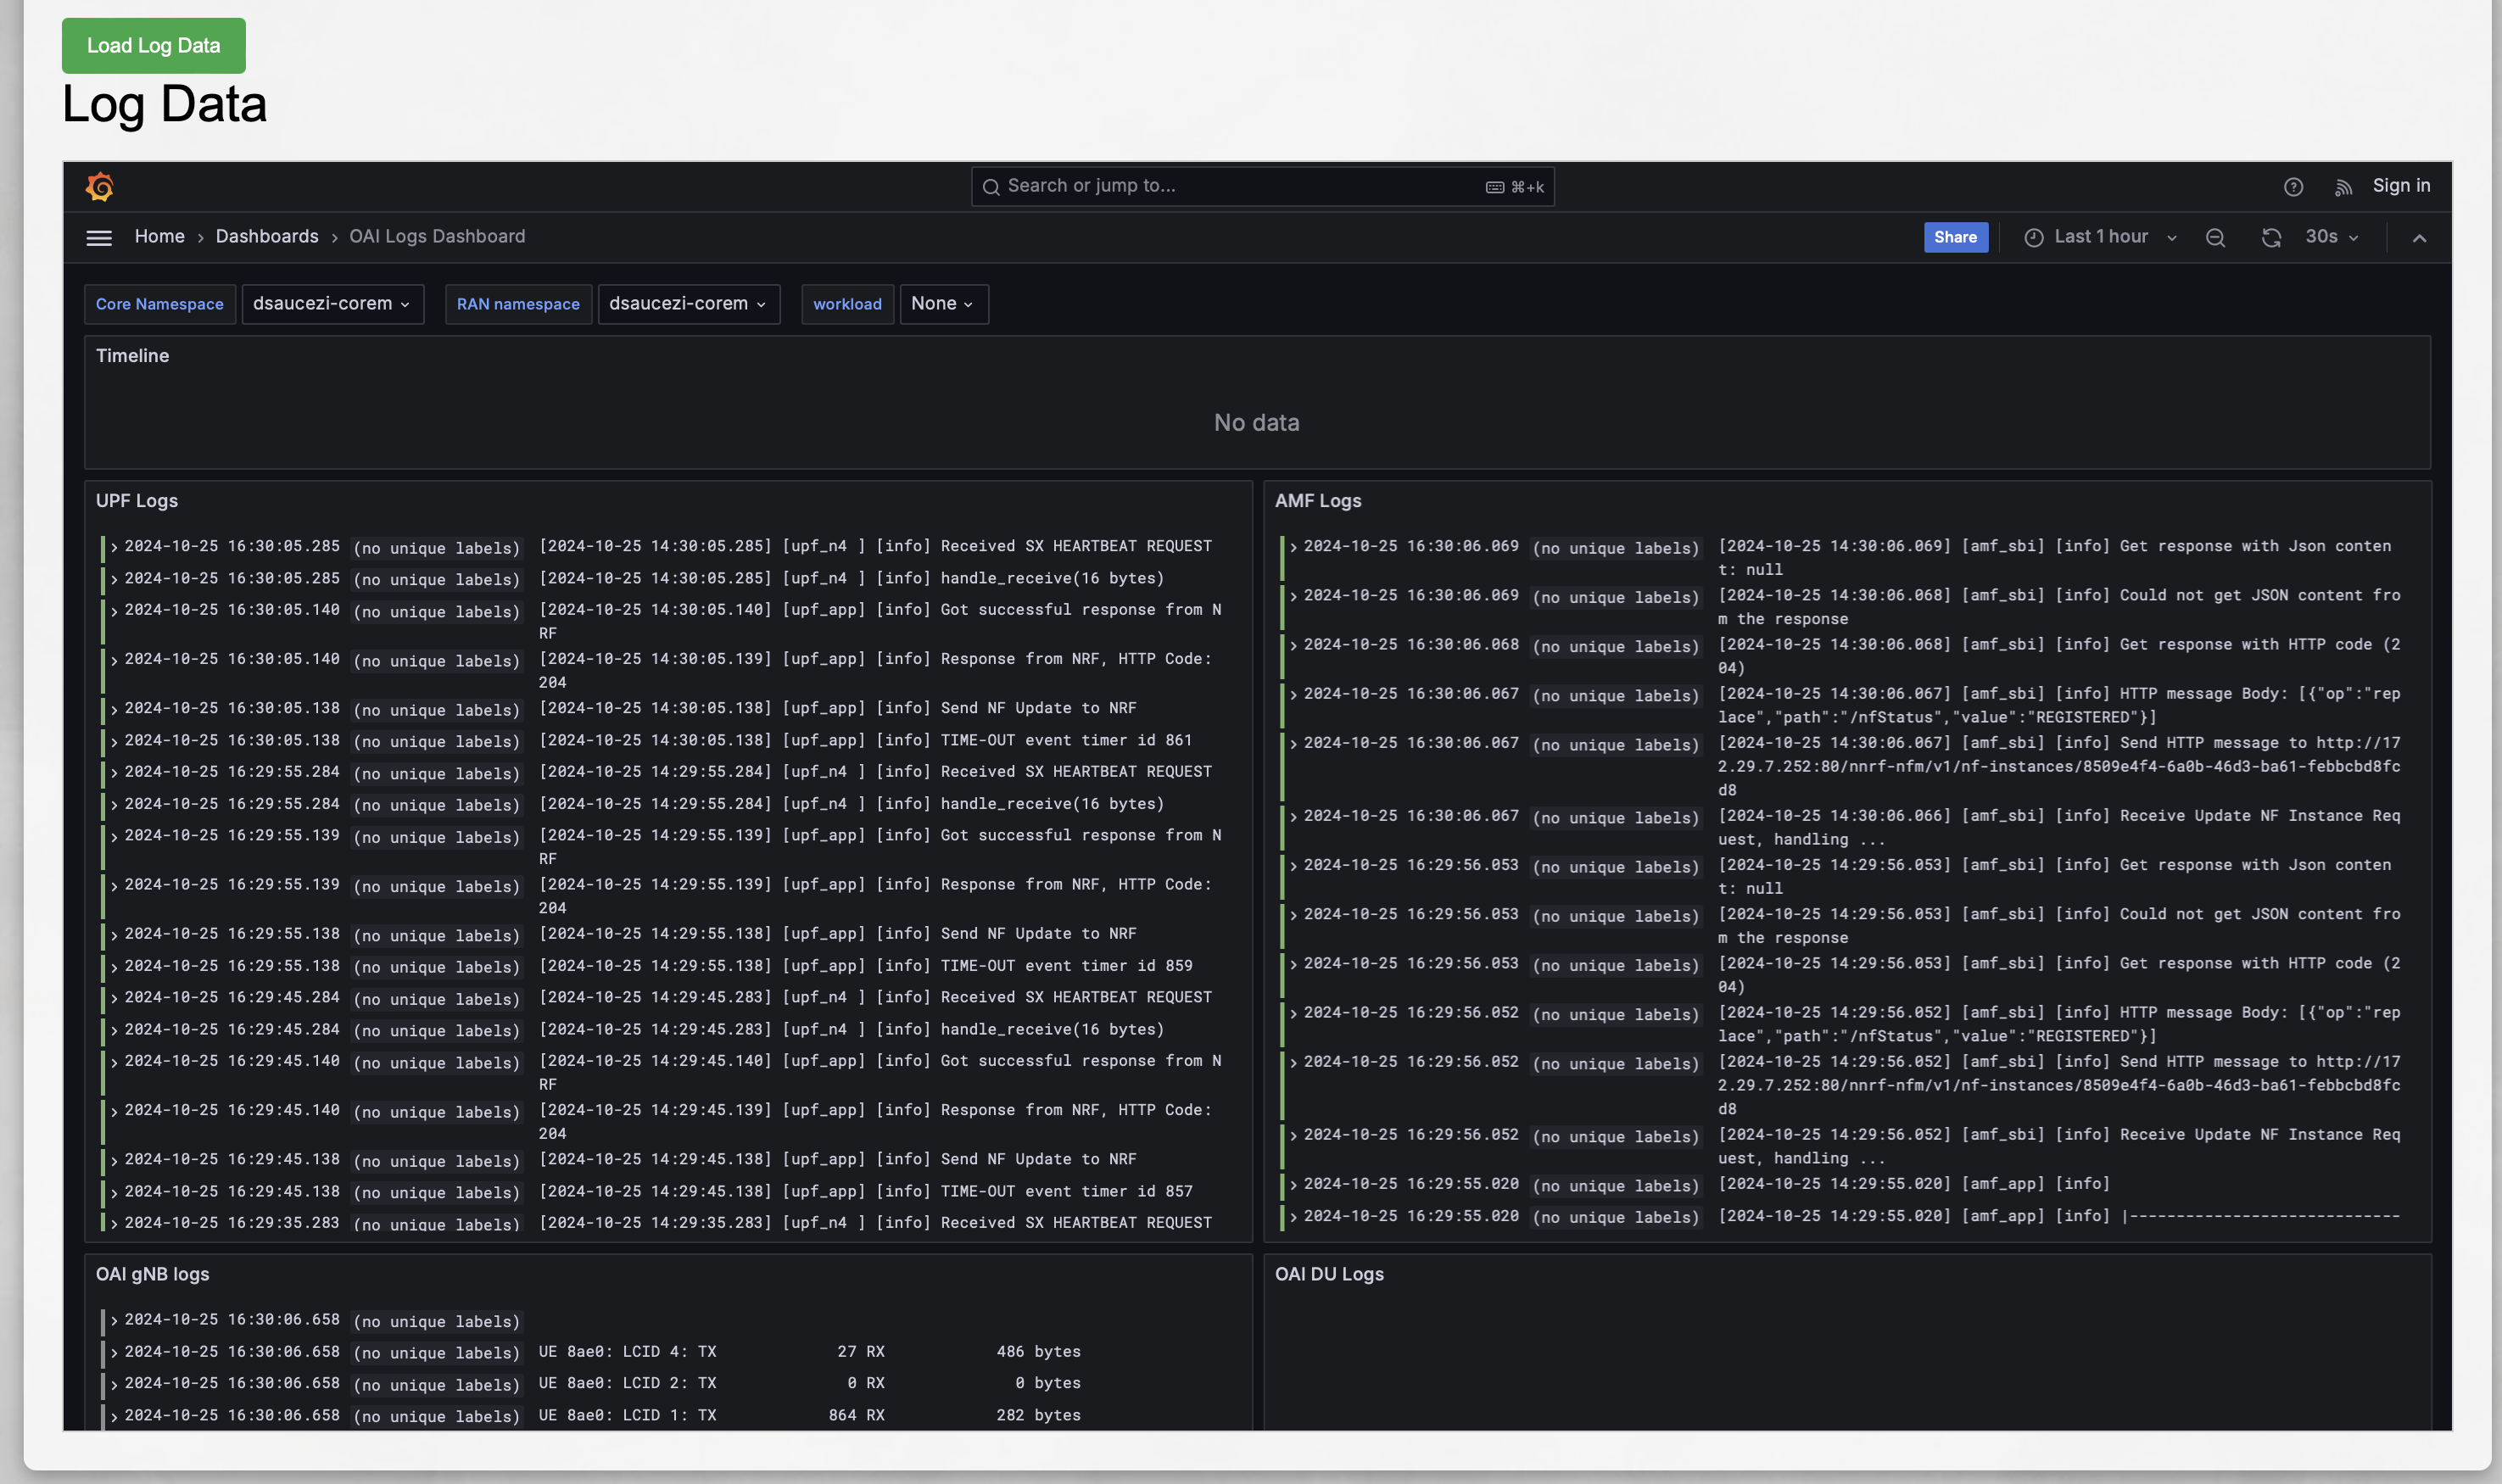
We also gather detailed information on the workload deployed within the Kubernetes clusters. To access it, click the Load Log Data button. Select the namespaces used for deploying your core and RAN infrastructure (those defined during the step-by-step setup). You’ll see a view similar to the one below.
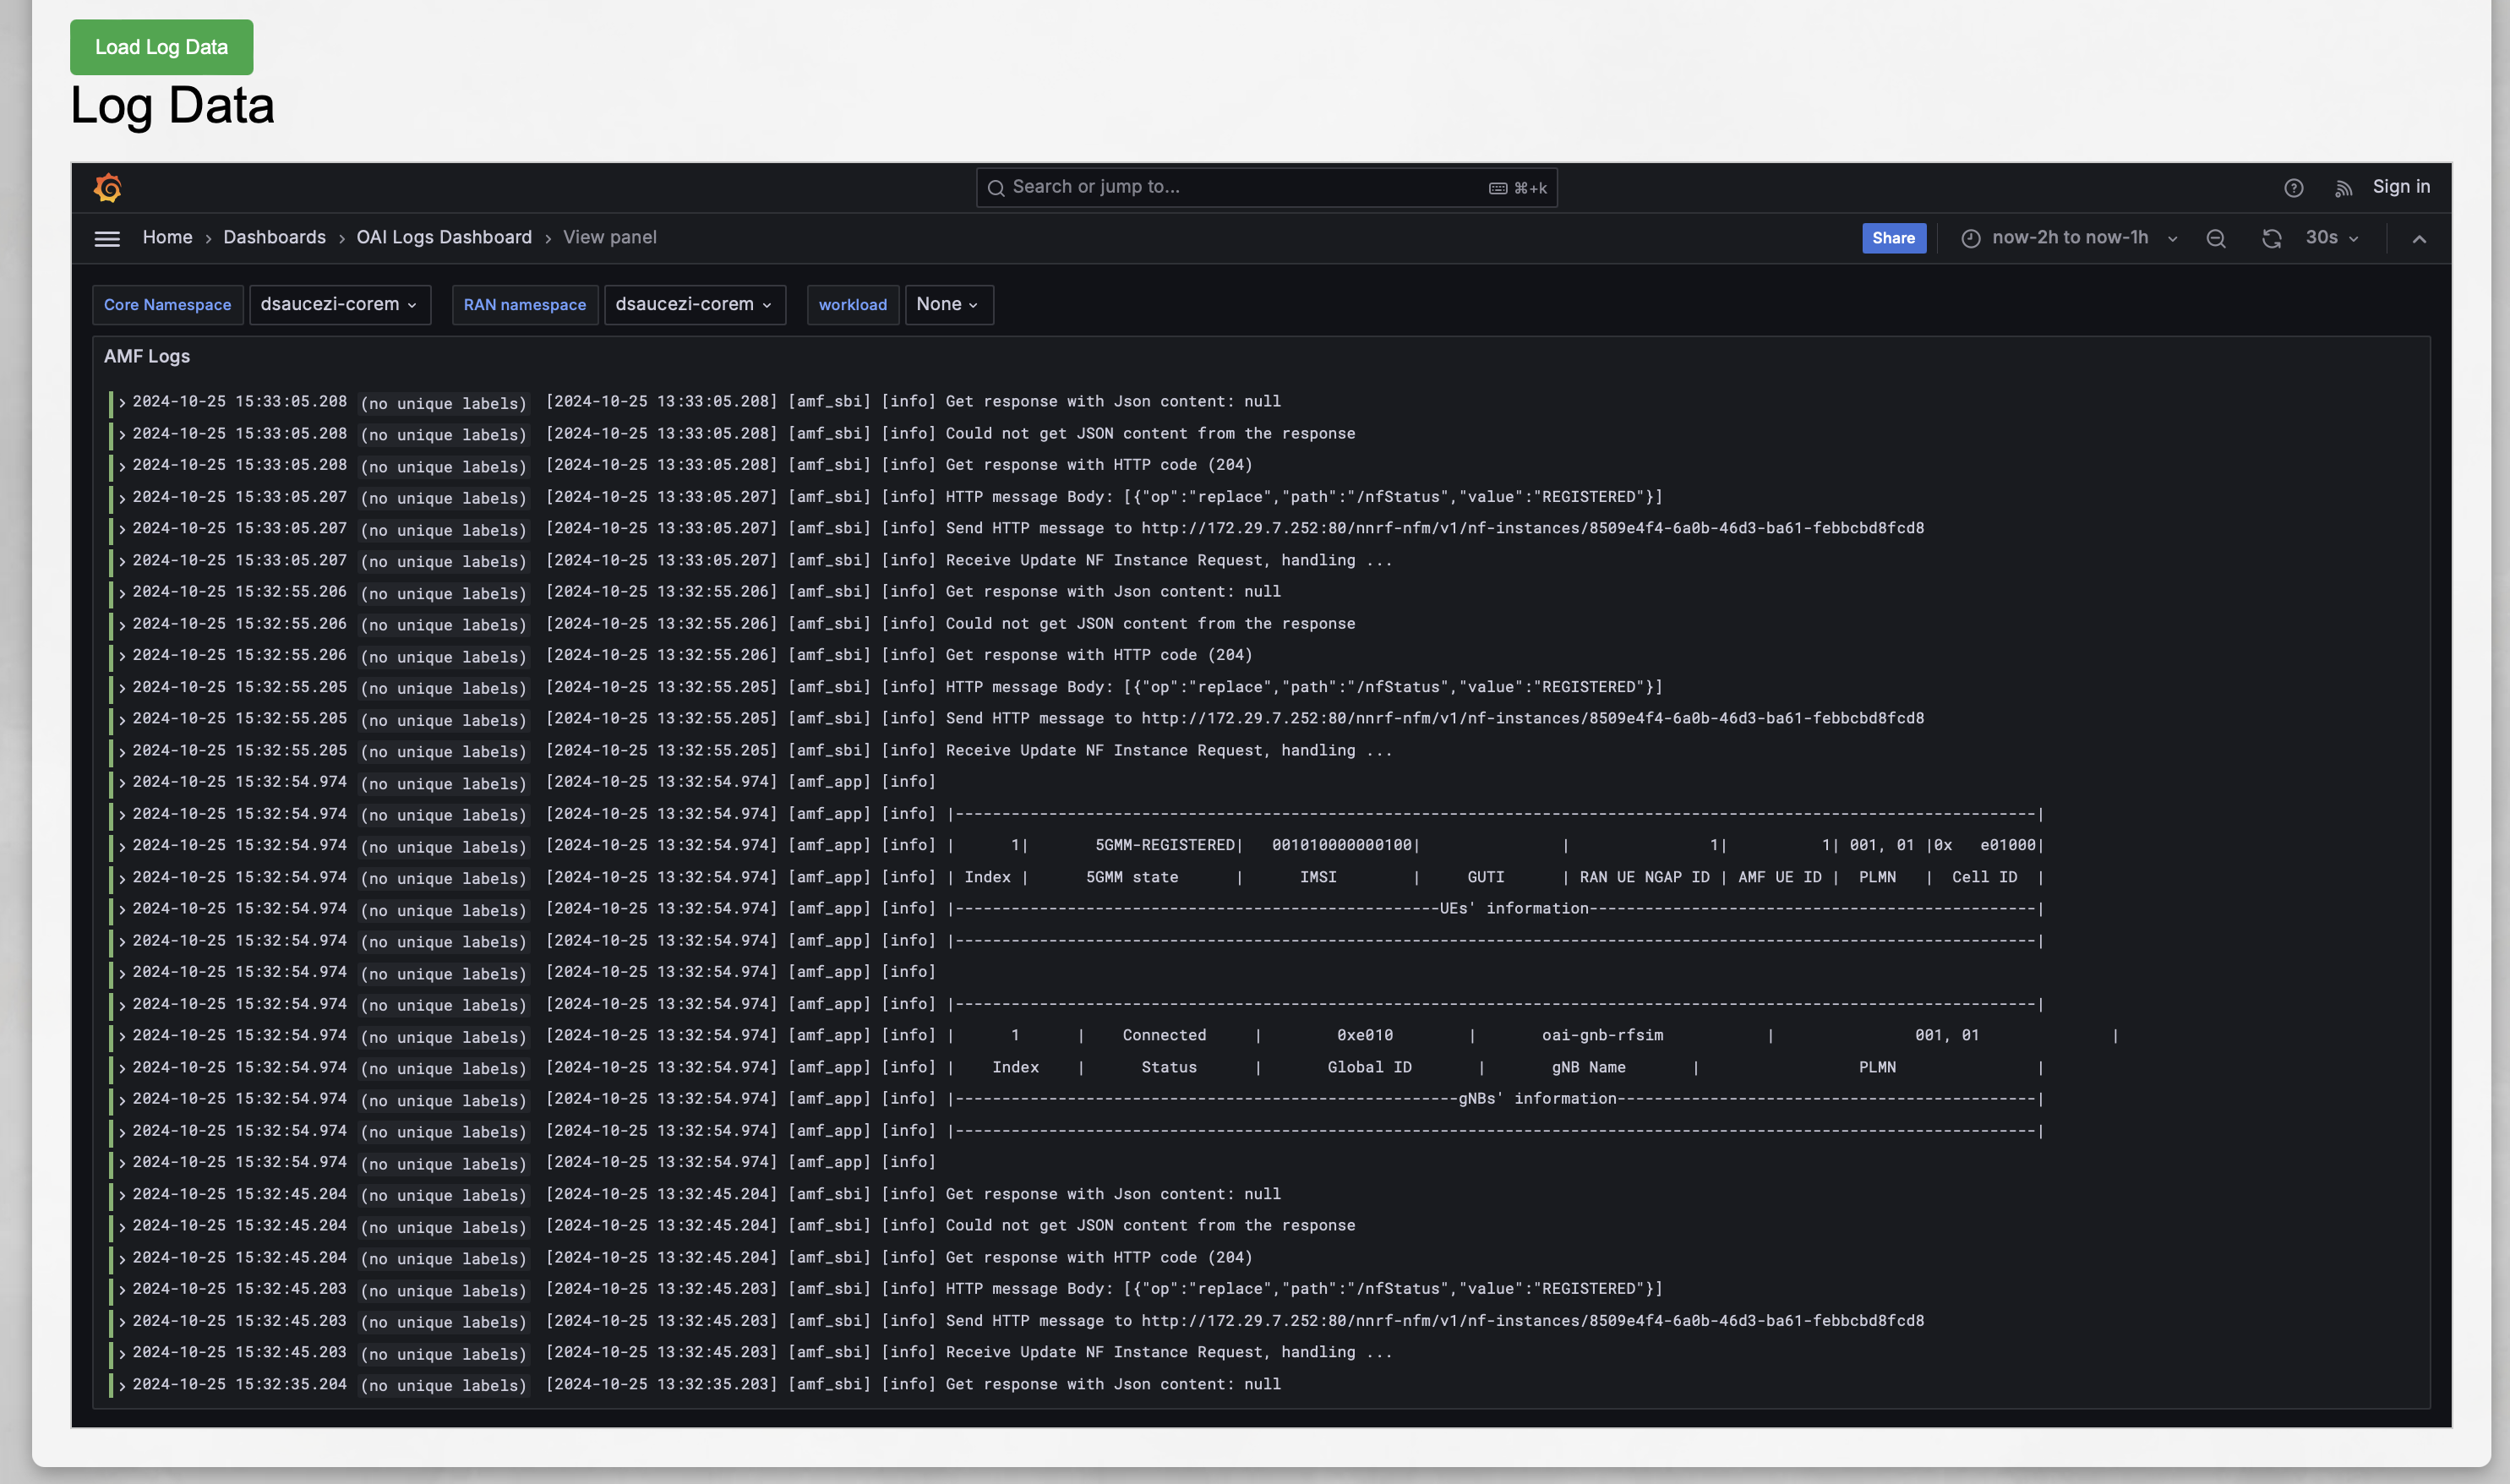
This dashboard allows us, for example, to view the AMF logs, providing insights into information about the gNB and UE, as shown below. Go and play around.
If you closely examine the experiment definition provided on the simple ping example repository and what we executed in this experiment, you’ll notice that only the output of the Ansible playbook was retained, which may be insufficient for reproducibility or debugging. The opportunistic data collection approach of SLICES, however, gives you much more detailed information about experiments at no additional cost.
Step 6 - Release resources
SLICES-RI operates as a shared infrastructure with finite resources. During the pre-operational phase, resources are not automatically released to facilitate debugging. However, if your experiment has concluded successfully and you consider it complete, we recommend releasing the resources associated with it using the following command:
post5g experiment cleanup my_experiment
This command will free up resources from the Kubernetes cluster as well as release the associated IP addresses and prefixes.
Next steps
The experiment itself is complete (i.e., we’ve successfully performed the ping). However, if you’re interested in exploring further, you can connect to the deployment node and experiment with various components. From the pos Webshell, simply use SSH to access it:
ssh -i ~/.ssh/id_rsa standard-2-1
The goal here isn’t to provide a detailed explanation, but rather to spark your curiosity and encourage further exploration. If you’re familiar with OpenAirInterface, you’ll feel at home since we use this software suite for the Post-5G blueprint reference implementation.
The deployment node has access to the SLICES-RI cluster where your experiment is deployed. For instance, if you deployed your 5G network in the namespace called core, you can gather information about the deployment with the following command. Keep in mind that as a standard user, your namespaces are prefixed by the experiment ID and username (e.g., core would be <expid>-<username>-core, where <username> is your SLICES preferred username):
root@standard-2-1:~# kubectl get -o wide -n core all
and obtain a result similar to
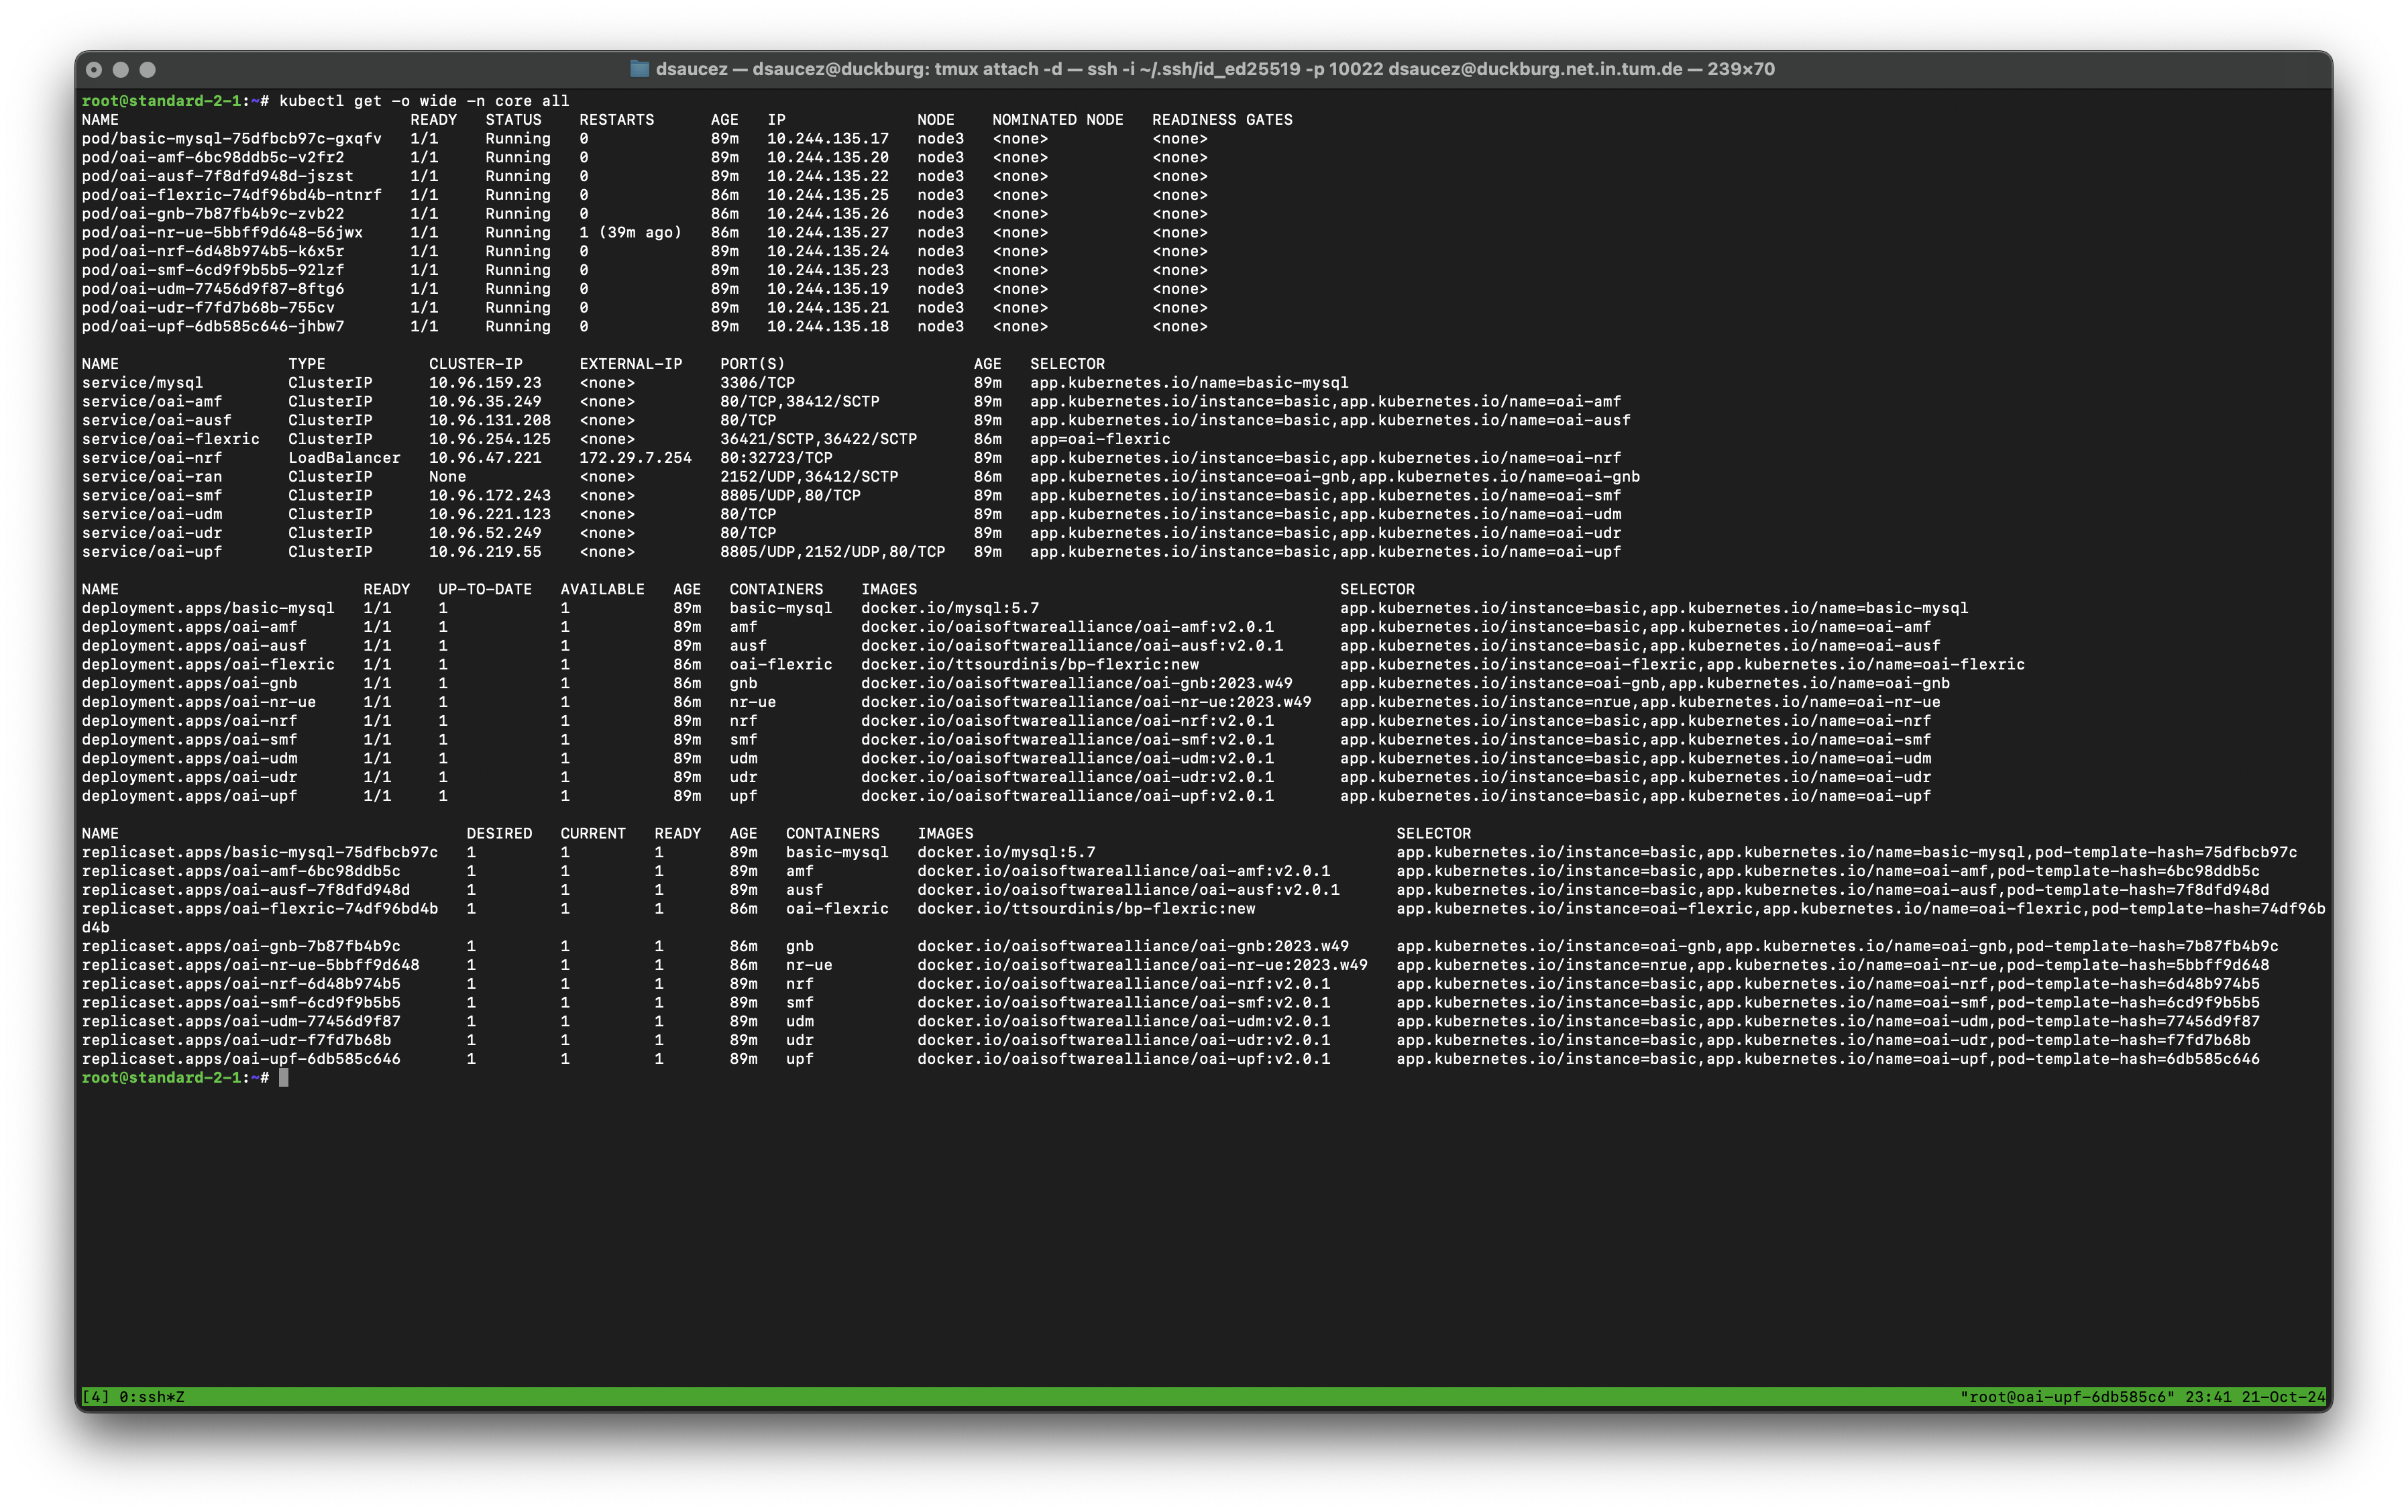
We can confirm that our NRF is accessible through the NRF Load Balancer IP provided earlier in the step-by-step guide. Now, let’s query the NRF API to retrieve information about the UPF, SMF, or AMF:
root@standard-2-1:~# curl http:/172.29.7.254/nnrf-nfm/v1/nf-instances?nf-type='UPF' --http2-prior-knowledge --silent
{"_links":{"item":[{"href":"172.29.6.229"}],"self":""}}root@standard-2-1:~#
root@standard-2-1:~# curl http:/172.29.7.254/nnrf-nfm/v1/nf-instances?nf-type='SMF' --http2-prior-knowledge --silent
{"_links":{"item":[{"href":"10.244.135.23"}],"self":""}}root@standard-2-1:~#
root@standard-2-1:~# curl http:/172.29.7.254/nnrf-nfm/v1/nf-instances?nf-type='AMF' --http2-prior-knowledge --silent
{"_links":{"item":[{"href":"10.244.135.20"}],"self":""}}root@standard-2-1:~#
Additionally, we can observe that a FlexRIC instance has been deployed in the cluster. To check its logs, use the following command:
root@standard-2-1:~# kubectl logs -n core oai-flexric-74df96bd4b-ntnrf
[UTIL]: Setting the config -c file to /usr/local/etc/flexric/flexric.conf
[UTIL]: Setting path -p for the shared libraries to /usr/local/lib/flexric/
[NEAR-RIC]: nearRT-RIC IP Address = 10.244.135.25, PORT = 36421
[NEAR-RIC]: Initializing
[NEAR-RIC]: Loading SM ID = 145 with def = SLICE_STATS_V0
[NEAR-RIC]: Loading SM ID = 144 with def = PDCP_STATS_V0
[NEAR-RIC]: Loading SM ID = 2 with def = ORAN-E2SM-KPM
[NEAR-RIC]: Loading SM ID = 3 with def = ORAN-E2SM-RC
[NEAR-RIC]: Loading SM ID = 148 with def = GTP_STATS_V0
[NEAR-RIC]: Loading SM ID = 143 with def = RLC_STATS_V0
[NEAR-RIC]: Loading SM ID = 146 with def = TC_STATS_V0
[NEAR-RIC]: Loading SM ID = 142 with def = MAC_STATS_V0
[iApp]: Initializing ...
[iApp]: nearRT-RIC IP Address = 10.244.135.25, PORT = 36422
[NEAR-RIC]: Initializing Task Manager with 2 threads
[E2AP]: E2 SETUP-REQUEST rx from PLMN   1. 1 Node ID 3587 RAN type ngran_gNB
[NEAR-RIC]: Accepting RAN function ID 2 with def = ORAN-E2SM-KPM
[NEAR-RIC]: Accepting RAN function ID 3 with def = ORAN-E2SM-RC
[NEAR-RIC]: Accepting RAN function ID 142 with def = MAC_STATS_V0
[NEAR-RIC]: Accepting RAN function ID 143 with def = RLC_STATS_V0
[NEAR-RIC]: Accepting RAN function ID 144 with def = PDCP_STATS_V0
[NEAR-RIC]: Accepting RAN function ID 145 with def = SLICE_STATS_V0
[NEAR-RIC]: Accepting RAN function ID 146 with def = TC_STATS_V0
[NEAR-RIC]: Accepting RAN function ID 148 with def = GTP_STATS_V0
We haven’t run any specific xAPP, but as we can see, the gNB 3587 is connected to it. From the gNB logs, we can confirm that the same ID is being used and that it is connected to the RIC.
root@standard-2-1:~# kubectl logs  -n core oai-gnb-7b87fb4b9c-zvb22 | grep E2
After RCconfig_NR_E2agent /usr/local/lib/flexric/ 10.96.254.125
[E2 NODE]: mcc = 1 mnc = 1 mnc_digit = 2 nb_id = 3587
[E2 NODE]: Args 10.96.254.125 /usr/local/lib/flexric/
[E2 AGENT]: nearRT-RIC IP Address = 10.96.254.125, PORT = 36421, RAN type = ngran_gNB, nb_id = 3587
[E2 AGENT]: Initializing ...
[E2 AGENT]: Opening plugin from path = /usr/local/lib/flexric/libslice_sm.so
[E2 AGENT]: Opening plugin from path = /usr/local/lib/flexric/libpdcp_sm.so
[E2 AGENT]: Opening plugin from path = /usr/local/lib/flexric/libkpm_sm.so
[E2 AGENT]: Opening plugin from path = /usr/local/lib/flexric/libgtp_sm.so
[E2 AGENT]: Opening plugin from path = /usr/local/lib/flexric/librlc_sm.so
[E2 AGENT]: Opening plugin from path = /usr/local/lib/flexric/libtc_sm.so
[E2 AGENT]: Opening plugin from path = /usr/local/lib/flexric/libmac_sm.so
[E2-AGENT]: Sending setup request
[E2-AGENT]: E2 SETUP-RESPONSE received
[E2-AGENT]: stopping pending
[E2-AGENT]: Transaction ID E2 SETUP-REQUEST 0 E2 SETUP-RESPONSE 0
When you’re finished, be sure to manually release the resources you obtained for your experiment using the command below. In production phase, this will be automatically released when the experiment ends, but for now, to give you more flexibility during testing, this task is left to you. Be kind with the infrastructure for the other researchers.
post5g experiment cleanup my_experiment
Debugging
If something goes wrong during the experiment, we recommend first checking the output of the various commands executed by POS. POS automatically saves the standard output and standard error for the experiment’s execution. If your deployment node is standard-2-1, you can locate these files with the following command:
ALLOC_ID=$(pos allocations show standard-2-1 | jq -r .id)
RESULTS_FOLDER="/srv/testbed/results/$(pos allocations show $ALLOC_ID | jq -r .result_folder)"
The RESULTS_FOLDER variable will contain the path to the POS logs for the current experiment.
If these logs do not reveal any issues, you can investigate further on the Kubernetes cluster. To do so, connect to your deployment node (e.g., standard-2-1) via SSH:
ssh -i ~/.ssh/id_rsa standard-2-1
From there, you can list the resources deployed in the cluster using the following command.
root@standard-2-1:~# kubectl get -o wide -n <experiment_id>-<login>-<ns> all
Where
<ns>is the namespace that you desire to analyse and that you specified during the configuration phase;<login>is your login;<experiment_id>is the experiment ID; you can retrieve this ID by typing thepos_get_variable -g xp_idcommand on the deployment node.
Debugging Kubernetes pods in detail is beyond the scope of this document, so please refer to the official Kubernetes documentation for Debugging Running Pods. Generally, a good starting point is to check the logs of each 5G function using the kubectl logs command.